Basque vs Syrian Ambulatory Disability
COMPARE
Basque
Syrian
Ambulatory Disability
Ambulatory Disability Comparison
Basques
Syrians
6.1%
AMBULATORY DISABILITY
63.7/ 100
METRIC RATING
164th/ 347
METRIC RANK
6.0%
AMBULATORY DISABILITY
75.5/ 100
METRIC RATING
153rd/ 347
METRIC RANK
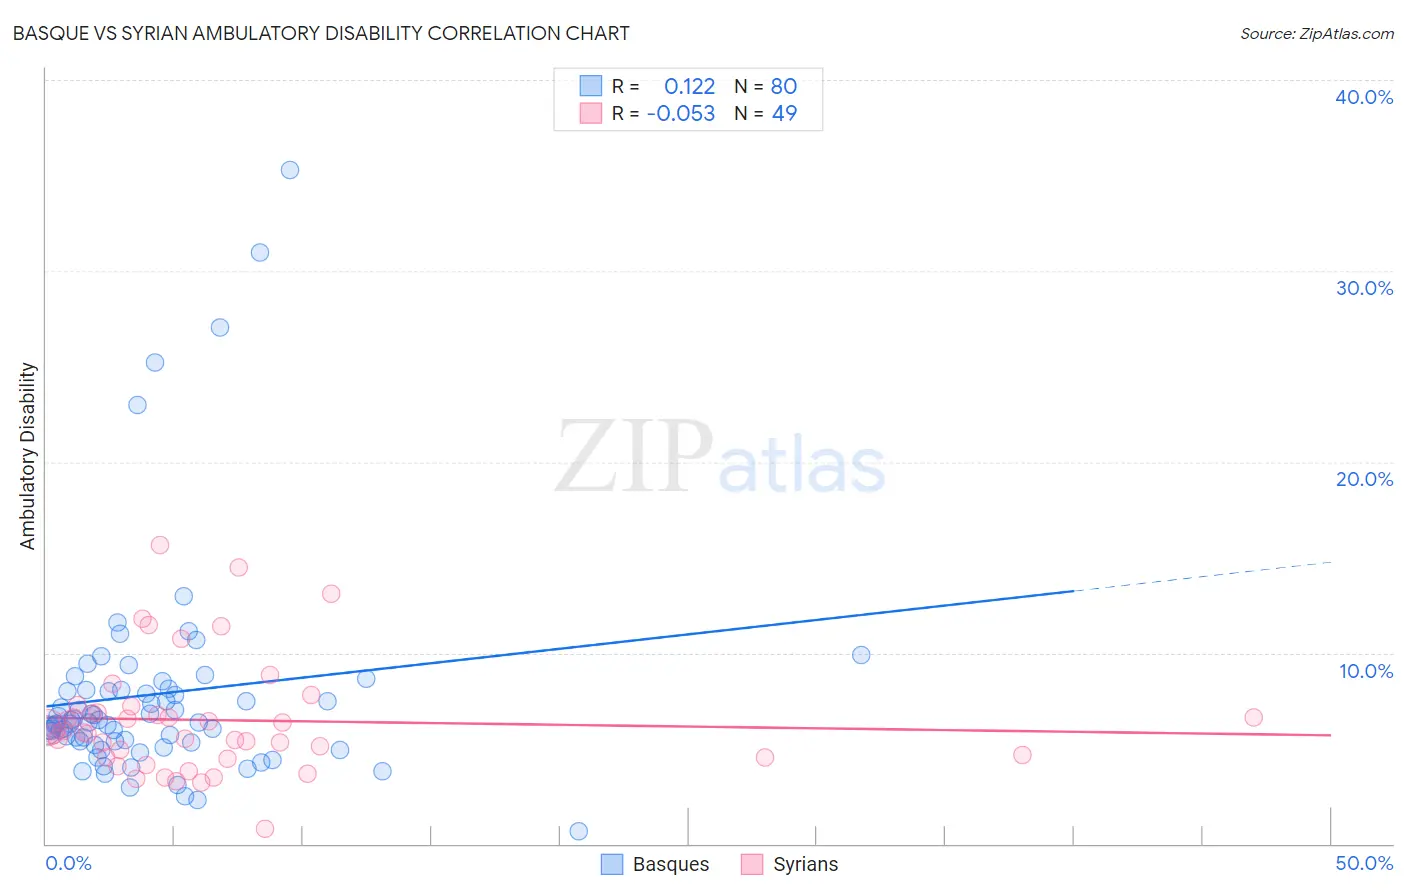
Basque vs Syrian Ambulatory Disability Correlation Chart
The statistical analysis conducted on geographies consisting of 165,766,481 people shows a poor positive correlation between the proportion of Basques and percentage of population with ambulatory disability in the United States with a correlation coefficient (R) of 0.122 and weighted average of 6.1%. Similarly, the statistical analysis conducted on geographies consisting of 266,278,347 people shows a slight negative correlation between the proportion of Syrians and percentage of population with ambulatory disability in the United States with a correlation coefficient (R) of -0.053 and weighted average of 6.0%, a difference of 0.75%.
Ambulatory Disability Correlation Summary
| Measurement | Basque | Syrian |
| Minimum | 0.67% | 0.77% |
| Maximum | 35.3% | 15.6% |
| Range | 34.6% | 14.8% |
| Mean | 7.8% | 6.5% |
| Median | 6.4% | 5.8% |
| Interquartile 25% (IQ1) | 5.3% | 4.5% |
| Interquartile 75% (IQ3) | 8.0% | 7.0% |
| Interquartile Range (IQR) | 2.7% | 2.5% |
| Standard Deviation (Sample) | 5.8% | 3.0% |
| Standard Deviation (Population) | 5.8% | 3.0% |
Demographics Similar to Basques and Syrians by Ambulatory Disability
In terms of ambulatory disability, the demographic groups most similar to Basques are Nicaraguan (6.1%, a difference of 0.030%), Iraqi (6.1%, a difference of 0.050%), Lebanese (6.1%, a difference of 0.15%), Immigrants from Oceania (6.1%, a difference of 0.17%), and Ecuadorian (6.1%, a difference of 0.18%). Similarly, the demographic groups most similar to Syrians are Immigrants from Croatia (6.0%, a difference of 0.030%), Immigrants from Scotland (6.0%, a difference of 0.23%), Immigrants from Austria (6.0%, a difference of 0.25%), Northern European (6.0%, a difference of 0.25%), and Ghanaian (6.0%, a difference of 0.29%).
| Demographics | Rating | Rank | Ambulatory Disability |
| Immigrants | Eastern Europe | 82.0 /100 | #148 | Excellent 6.0% |
| Lithuanians | 81.9 /100 | #149 | Excellent 6.0% |
| Maltese | 81.6 /100 | #150 | Excellent 6.0% |
| Greeks | 79.6 /100 | #151 | Good 6.0% |
| Immigrants | Austria | 78.8 /100 | #152 | Good 6.0% |
| Syrians | 75.5 /100 | #153 | Good 6.0% |
| Immigrants | Croatia | 75.1 /100 | #154 | Good 6.0% |
| Immigrants | Scotland | 72.1 /100 | #155 | Good 6.0% |
| Northern Europeans | 71.8 /100 | #156 | Good 6.0% |
| Ghanaians | 71.3 /100 | #157 | Good 6.0% |
| Immigrants | Fiji | 71.2 /100 | #158 | Good 6.0% |
| Immigrants | Latvia | 71.1 /100 | #159 | Good 6.0% |
| Central Americans | 69.8 /100 | #160 | Good 6.0% |
| Immigrants | Belarus | 69.2 /100 | #161 | Good 6.1% |
| Nigerians | 67.1 /100 | #162 | Good 6.1% |
| Lebanese | 66.2 /100 | #163 | Good 6.1% |
| Basques | 63.7 /100 | #164 | Good 6.1% |
| Nicaraguans | 63.2 /100 | #165 | Good 6.1% |
| Iraqis | 62.8 /100 | #166 | Good 6.1% |
| Immigrants | Oceania | 60.7 /100 | #167 | Good 6.1% |
| Ecuadorians | 60.5 /100 | #168 | Good 6.1% |