Latvian vs Irish Single Mother Poverty
COMPARE
Latvian
Irish
Single Mother Poverty
Single Mother Poverty Comparison
Latvians
Irish
26.9%
SINGLE MOTHER POVERTY
99.9/ 100
METRIC RATING
45th/ 347
METRIC RANK
29.8%
SINGLE MOTHER POVERTY
13.9/ 100
METRIC RATING
209th/ 347
METRIC RANK
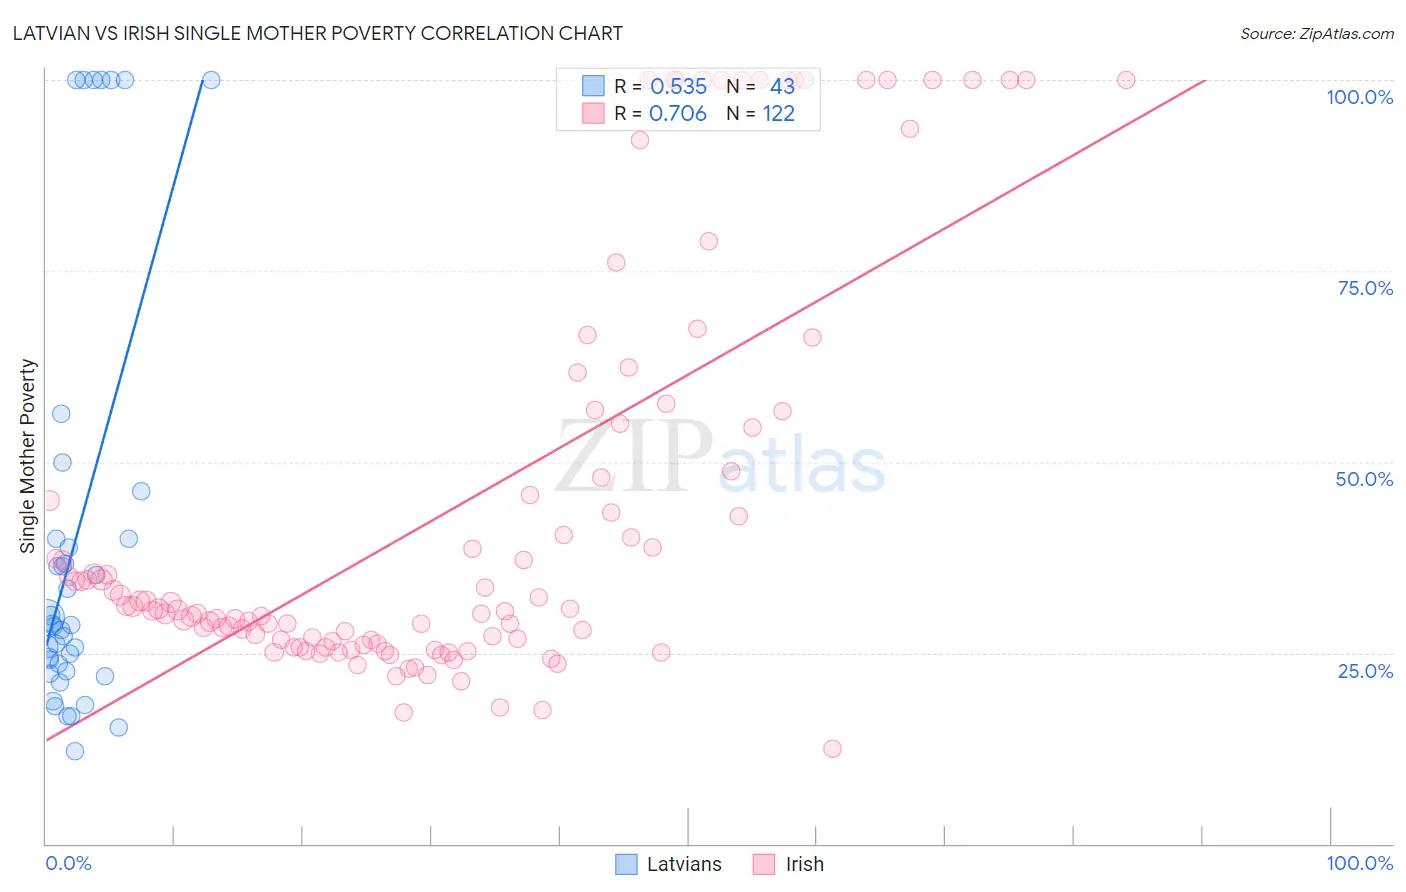
Latvian vs Irish Single Mother Poverty Correlation Chart
The statistical analysis conducted on geographies consisting of 216,142,083 people shows a substantial positive correlation between the proportion of Latvians and poverty level among single mothers in the United States with a correlation coefficient (R) of 0.535 and weighted average of 26.9%. Similarly, the statistical analysis conducted on geographies consisting of 549,467,184 people shows a strong positive correlation between the proportion of Irish and poverty level among single mothers in the United States with a correlation coefficient (R) of 0.706 and weighted average of 29.8%, a difference of 10.9%.
Single Mother Poverty Correlation Summary
| Measurement | Latvian | Irish |
| Minimum | 12.0% | 12.4% |
| Maximum | 100.0% | 100.0% |
| Range | 88.0% | 87.6% |
| Mean | 40.2% | 43.8% |
| Median | 28.6% | 30.8% |
| Interquartile 25% (IQ1) | 22.6% | 26.6% |
| Interquartile 75% (IQ3) | 40.0% | 54.5% |
| Interquartile Range (IQR) | 17.4% | 28.0% |
| Standard Deviation (Sample) | 28.2% | 26.6% |
| Standard Deviation (Population) | 27.9% | 26.5% |
Similar Demographics by Single Mother Poverty
Demographics Similar to Latvians by Single Mother Poverty
In terms of single mother poverty, the demographic groups most similar to Latvians are Immigrants from Serbia (26.9%, a difference of 0.040%), Immigrants from Sierra Leone (26.9%, a difference of 0.070%), Egyptian (26.9%, a difference of 0.10%), Immigrants from Poland (26.9%, a difference of 0.18%), and Tsimshian (26.8%, a difference of 0.21%).
| Demographics | Rating | Rank | Single Mother Poverty |
| Immigrants | Fiji | 99.9 /100 | #38 | Exceptional 26.6% |
| Sri Lankans | 99.9 /100 | #39 | Exceptional 26.7% |
| Immigrants | Vietnam | 99.9 /100 | #40 | Exceptional 26.7% |
| Immigrants | Greece | 99.9 /100 | #41 | Exceptional 26.7% |
| Armenians | 99.9 /100 | #42 | Exceptional 26.8% |
| Tsimshian | 99.9 /100 | #43 | Exceptional 26.8% |
| Immigrants | Sierra Leone | 99.9 /100 | #44 | Exceptional 26.9% |
| Latvians | 99.9 /100 | #45 | Exceptional 26.9% |
| Immigrants | Serbia | 99.9 /100 | #46 | Exceptional 26.9% |
| Egyptians | 99.8 /100 | #47 | Exceptional 26.9% |
| Immigrants | Poland | 99.8 /100 | #48 | Exceptional 26.9% |
| Cambodians | 99.8 /100 | #49 | Exceptional 27.0% |
| Laotians | 99.8 /100 | #50 | Exceptional 27.0% |
| Immigrants | Argentina | 99.7 /100 | #51 | Exceptional 27.1% |
| Immigrants | South Eastern Asia | 99.7 /100 | #52 | Exceptional 27.1% |
Demographics Similar to Irish by Single Mother Poverty
In terms of single mother poverty, the demographic groups most similar to Irish are Haitian (29.8%, a difference of 0.060%), Immigrants from Guyana (29.8%, a difference of 0.080%), Guyanese (29.8%, a difference of 0.11%), Immigrants from Panama (29.8%, a difference of 0.15%), and Nicaraguan (29.8%, a difference of 0.15%).
| Demographics | Rating | Rank | Single Mother Poverty |
| Malaysians | 17.4 /100 | #202 | Poor 29.7% |
| Swiss | 17.2 /100 | #203 | Poor 29.7% |
| Immigrants | Immigrants | 16.6 /100 | #204 | Poor 29.7% |
| Czechoslovakians | 16.1 /100 | #205 | Poor 29.7% |
| Immigrants | Haiti | 15.8 /100 | #206 | Poor 29.7% |
| Immigrants | Panama | 15.5 /100 | #207 | Poor 29.8% |
| Immigrants | Guyana | 14.7 /100 | #208 | Poor 29.8% |
| Irish | 13.9 /100 | #209 | Poor 29.8% |
| Haitians | 13.3 /100 | #210 | Poor 29.8% |
| Guyanese | 12.8 /100 | #211 | Poor 29.8% |
| Nicaraguans | 12.4 /100 | #212 | Poor 29.8% |
| Immigrants | Thailand | 12.0 /100 | #213 | Poor 29.9% |
| Liberians | 11.7 /100 | #214 | Poor 29.9% |
| Jamaicans | 11.7 /100 | #215 | Poor 29.9% |
| Immigrants | Western Africa | 11.5 /100 | #216 | Poor 29.9% |