Bangladeshi vs Paiute Child Poverty Among Girls Under 16
COMPARE
Bangladeshi
Paiute
Child Poverty Among Girls Under 16
Child Poverty Among Girls Under 16 Comparison
Bangladeshis
Paiute
20.0%
CHILD POVERTY AMONG GIRLS UNDER 16
0.1/ 100
METRIC RATING
273rd/ 347
METRIC RANK
22.6%
CHILD POVERTY AMONG GIRLS UNDER 16
0.0/ 100
METRIC RATING
324th/ 347
METRIC RANK
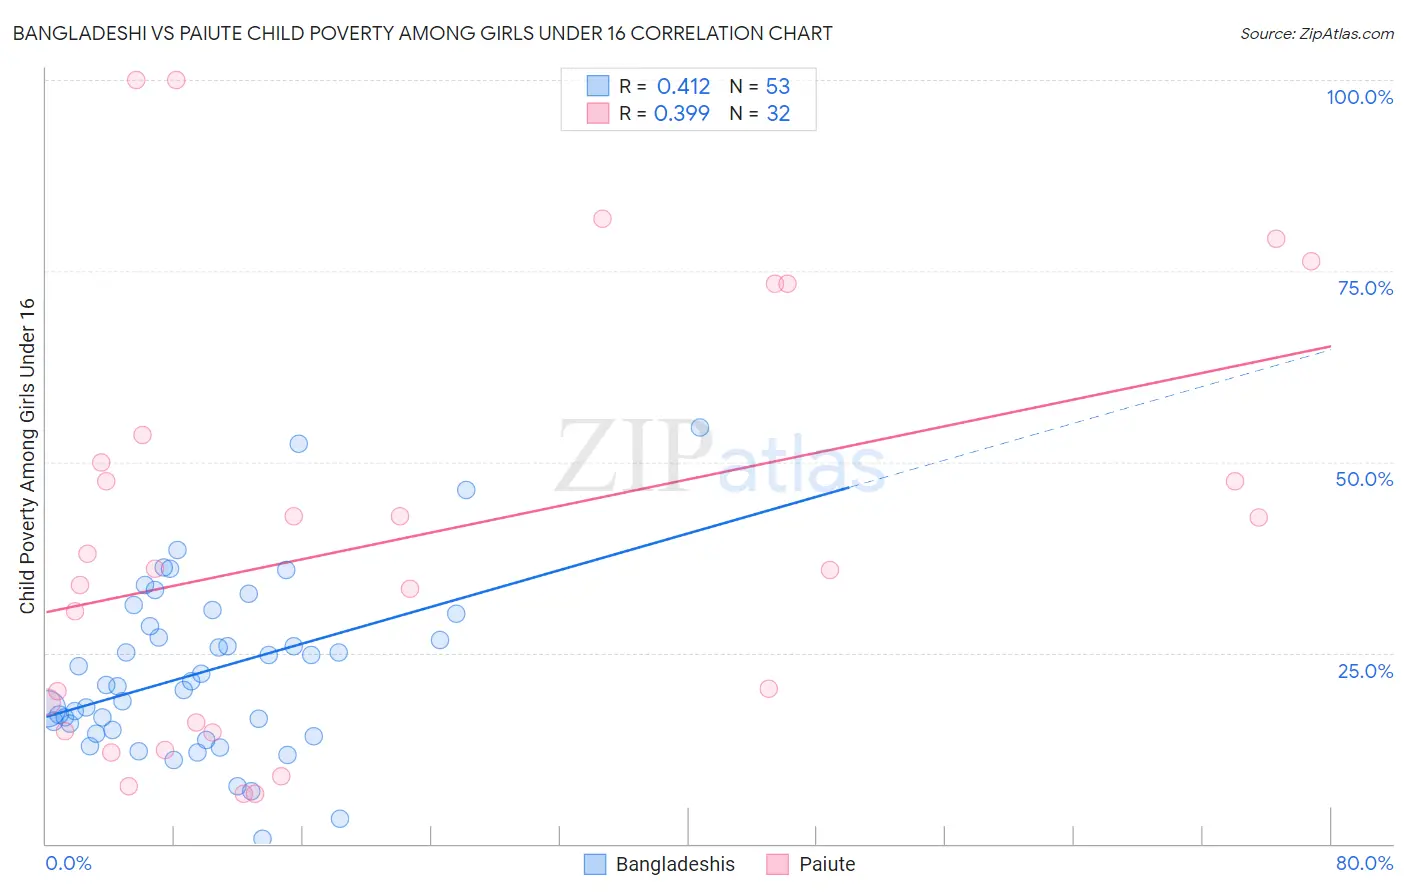
Bangladeshi vs Paiute Child Poverty Among Girls Under 16 Correlation Chart
The statistical analysis conducted on geographies consisting of 140,467,619 people shows a moderate positive correlation between the proportion of Bangladeshis and poverty level among girls under the age of 16 in the United States with a correlation coefficient (R) of 0.412 and weighted average of 20.0%. Similarly, the statistical analysis conducted on geographies consisting of 58,132,859 people shows a mild positive correlation between the proportion of Paiute and poverty level among girls under the age of 16 in the United States with a correlation coefficient (R) of 0.399 and weighted average of 22.6%, a difference of 13.2%.
Child Poverty Among Girls Under 16 Correlation Summary
| Measurement | Bangladeshi | Paiute |
| Minimum | 0.72% | 6.5% |
| Maximum | 54.5% | 100.0% |
| Range | 53.8% | 93.5% |
| Mean | 22.6% | 39.9% |
| Median | 20.7% | 35.9% |
| Interquartile 25% (IQ1) | 14.7% | 15.3% |
| Interquartile 75% (IQ3) | 29.3% | 51.8% |
| Interquartile Range (IQR) | 14.6% | 36.5% |
| Standard Deviation (Sample) | 11.2% | 27.6% |
| Standard Deviation (Population) | 11.1% | 27.1% |
Similar Demographics by Child Poverty Among Girls Under 16
Demographics Similar to Bangladeshis by Child Poverty Among Girls Under 16
In terms of child poverty among girls under 16, the demographic groups most similar to Bangladeshis are Immigrants from El Salvador (20.0%, a difference of 0.20%), Immigrants from Barbados (19.9%, a difference of 0.31%), Cherokee (19.9%, a difference of 0.41%), Immigrants from St. Vincent and the Grenadines (20.1%, a difference of 0.42%), and Subsaharan African (20.1%, a difference of 0.57%).
| Demographics | Rating | Rank | Child Poverty Among Girls Under 16 |
| Spanish Americans | 0.1 /100 | #266 | Tragic 19.8% |
| Immigrants | Bangladesh | 0.1 /100 | #267 | Tragic 19.9% |
| Spanish American Indians | 0.1 /100 | #268 | Tragic 19.9% |
| Liberians | 0.1 /100 | #269 | Tragic 19.9% |
| Cherokee | 0.1 /100 | #270 | Tragic 19.9% |
| Immigrants | Barbados | 0.1 /100 | #271 | Tragic 19.9% |
| Immigrants | El Salvador | 0.1 /100 | #272 | Tragic 20.0% |
| Bangladeshis | 0.1 /100 | #273 | Tragic 20.0% |
| Immigrants | St. Vincent and the Grenadines | 0.0 /100 | #274 | Tragic 20.1% |
| Sub-Saharan Africans | 0.0 /100 | #275 | Tragic 20.1% |
| Comanche | 0.0 /100 | #276 | Tragic 20.2% |
| Belizeans | 0.0 /100 | #277 | Tragic 20.2% |
| Barbadians | 0.0 /100 | #278 | Tragic 20.2% |
| Immigrants | Zaire | 0.0 /100 | #279 | Tragic 20.2% |
| Immigrants | Liberia | 0.0 /100 | #280 | Tragic 20.2% |
Demographics Similar to Paiute by Child Poverty Among Girls Under 16
In terms of child poverty among girls under 16, the demographic groups most similar to Paiute are Cajun (22.6%, a difference of 0.29%), Yakama (22.6%, a difference of 0.31%), Colville (22.5%, a difference of 0.50%), Immigrants from Congo (22.7%, a difference of 0.50%), and Immigrants from Honduras (22.8%, a difference of 0.63%).
| Demographics | Rating | Rank | Child Poverty Among Girls Under 16 |
| Africans | 0.0 /100 | #317 | Tragic 21.9% |
| Immigrants | Dominica | 0.0 /100 | #318 | Tragic 22.1% |
| U.S. Virgin Islanders | 0.0 /100 | #319 | Tragic 22.1% |
| Hondurans | 0.0 /100 | #320 | Tragic 22.2% |
| Colville | 0.0 /100 | #321 | Tragic 22.5% |
| Yakama | 0.0 /100 | #322 | Tragic 22.6% |
| Cajuns | 0.0 /100 | #323 | Tragic 22.6% |
| Paiute | 0.0 /100 | #324 | Tragic 22.6% |
| Immigrants | Congo | 0.0 /100 | #325 | Tragic 22.7% |
| Immigrants | Honduras | 0.0 /100 | #326 | Tragic 22.8% |
| Central American Indians | 0.0 /100 | #327 | Tragic 22.8% |
| Dominicans | 0.0 /100 | #328 | Tragic 23.7% |
| Kiowa | 0.0 /100 | #329 | Tragic 23.7% |
| Immigrants | Dominican Republic | 0.0 /100 | #330 | Tragic 23.8% |
| Apache | 0.0 /100 | #331 | Tragic 23.8% |