Bhutanese vs Paiute Child Poverty Among Girls Under 16
COMPARE
Bhutanese
Paiute
Child Poverty Among Girls Under 16
Child Poverty Among Girls Under 16 Comparison
Bhutanese
Paiute
12.7%
CHILD POVERTY AMONG GIRLS UNDER 16
100.0/ 100
METRIC RATING
12th/ 347
METRIC RANK
22.6%
CHILD POVERTY AMONG GIRLS UNDER 16
0.0/ 100
METRIC RATING
324th/ 347
METRIC RANK
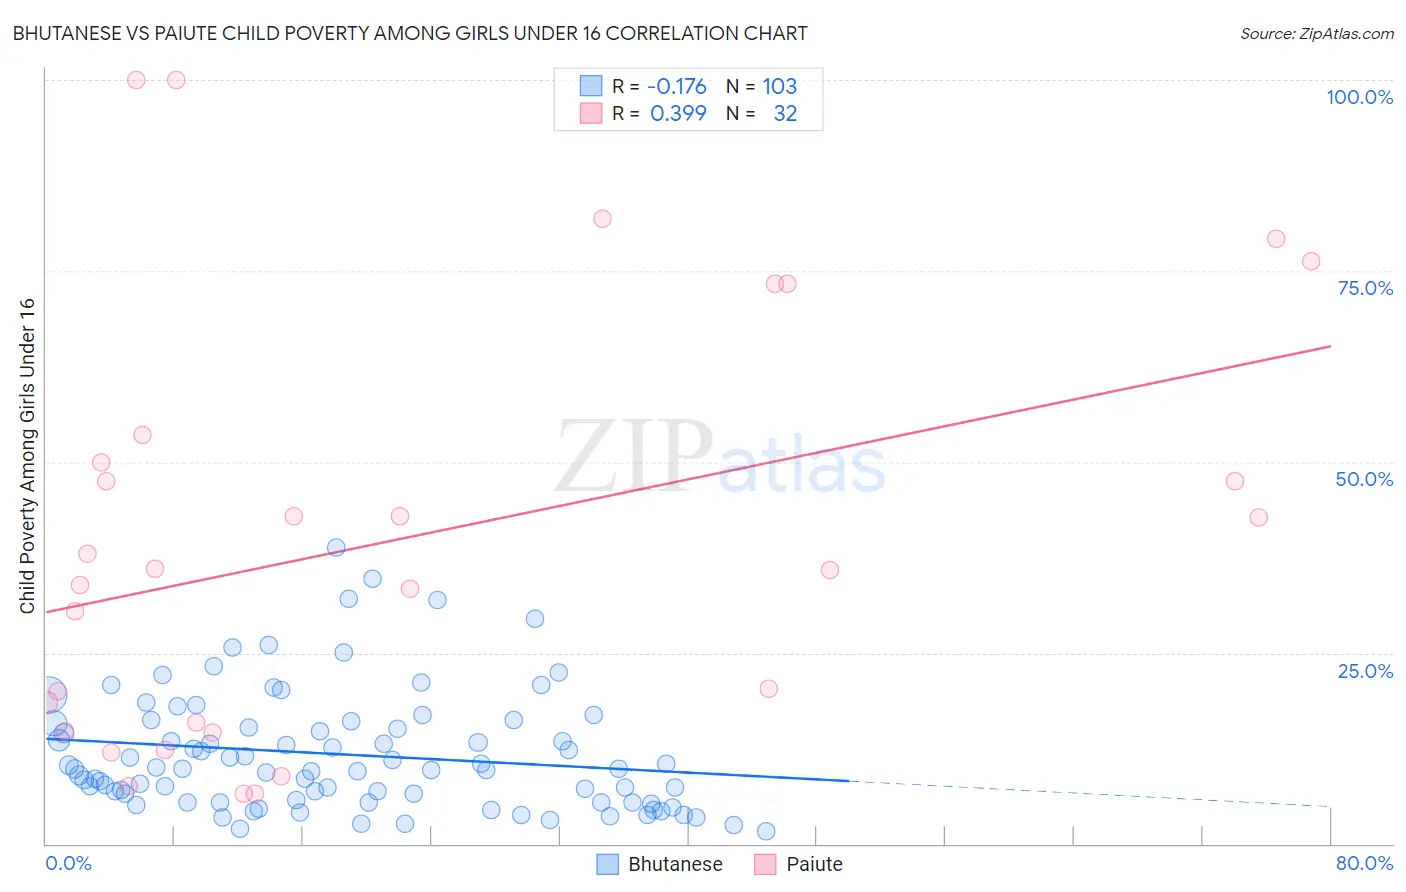
Bhutanese vs Paiute Child Poverty Among Girls Under 16 Correlation Chart
The statistical analysis conducted on geographies consisting of 445,391,232 people shows a poor negative correlation between the proportion of Bhutanese and poverty level among girls under the age of 16 in the United States with a correlation coefficient (R) of -0.176 and weighted average of 12.7%. Similarly, the statistical analysis conducted on geographies consisting of 58,132,859 people shows a mild positive correlation between the proportion of Paiute and poverty level among girls under the age of 16 in the United States with a correlation coefficient (R) of 0.399 and weighted average of 22.6%, a difference of 77.6%.
Child Poverty Among Girls Under 16 Correlation Summary
| Measurement | Bhutanese | Paiute |
| Minimum | 1.7% | 6.5% |
| Maximum | 38.7% | 100.0% |
| Range | 37.0% | 93.5% |
| Mean | 11.7% | 39.9% |
| Median | 9.8% | 35.9% |
| Interquartile 25% (IQ1) | 5.4% | 15.3% |
| Interquartile 75% (IQ3) | 15.8% | 51.8% |
| Interquartile Range (IQR) | 10.3% | 36.5% |
| Standard Deviation (Sample) | 7.7% | 27.6% |
| Standard Deviation (Population) | 7.7% | 27.1% |
Similar Demographics by Child Poverty Among Girls Under 16
Demographics Similar to Bhutanese by Child Poverty Among Girls Under 16
In terms of child poverty among girls under 16, the demographic groups most similar to Bhutanese are Immigrants from South Central Asia (12.7%, a difference of 0.040%), Immigrants from Ireland (12.9%, a difference of 1.0%), Immigrants from Iran (12.6%, a difference of 1.3%), Burmese (13.0%, a difference of 2.1%), and Okinawan (13.0%, a difference of 2.1%).
| Demographics | Rating | Rank | Child Poverty Among Girls Under 16 |
| Thais | 100.0 /100 | #5 | Exceptional 11.8% |
| Immigrants | Hong Kong | 100.0 /100 | #6 | Exceptional 12.3% |
| Chinese | 100.0 /100 | #7 | Exceptional 12.3% |
| Iranians | 100.0 /100 | #8 | Exceptional 12.4% |
| Immigrants | Singapore | 100.0 /100 | #9 | Exceptional 12.5% |
| Immigrants | Iran | 100.0 /100 | #10 | Exceptional 12.6% |
| Immigrants | South Central Asia | 100.0 /100 | #11 | Exceptional 12.7% |
| Bhutanese | 100.0 /100 | #12 | Exceptional 12.7% |
| Immigrants | Ireland | 99.9 /100 | #13 | Exceptional 12.9% |
| Burmese | 99.9 /100 | #14 | Exceptional 13.0% |
| Okinawans | 99.9 /100 | #15 | Exceptional 13.0% |
| Immigrants | Lithuania | 99.9 /100 | #16 | Exceptional 13.1% |
| Bulgarians | 99.9 /100 | #17 | Exceptional 13.1% |
| Immigrants | Korea | 99.9 /100 | #18 | Exceptional 13.1% |
| Cypriots | 99.9 /100 | #19 | Exceptional 13.2% |
Demographics Similar to Paiute by Child Poverty Among Girls Under 16
In terms of child poverty among girls under 16, the demographic groups most similar to Paiute are Cajun (22.6%, a difference of 0.29%), Yakama (22.6%, a difference of 0.31%), Colville (22.5%, a difference of 0.50%), Immigrants from Congo (22.7%, a difference of 0.50%), and Immigrants from Honduras (22.8%, a difference of 0.63%).
| Demographics | Rating | Rank | Child Poverty Among Girls Under 16 |
| Africans | 0.0 /100 | #317 | Tragic 21.9% |
| Immigrants | Dominica | 0.0 /100 | #318 | Tragic 22.1% |
| U.S. Virgin Islanders | 0.0 /100 | #319 | Tragic 22.1% |
| Hondurans | 0.0 /100 | #320 | Tragic 22.2% |
| Colville | 0.0 /100 | #321 | Tragic 22.5% |
| Yakama | 0.0 /100 | #322 | Tragic 22.6% |
| Cajuns | 0.0 /100 | #323 | Tragic 22.6% |
| Paiute | 0.0 /100 | #324 | Tragic 22.6% |
| Immigrants | Congo | 0.0 /100 | #325 | Tragic 22.7% |
| Immigrants | Honduras | 0.0 /100 | #326 | Tragic 22.8% |
| Central American Indians | 0.0 /100 | #327 | Tragic 22.8% |
| Dominicans | 0.0 /100 | #328 | Tragic 23.7% |
| Kiowa | 0.0 /100 | #329 | Tragic 23.7% |
| Immigrants | Dominican Republic | 0.0 /100 | #330 | Tragic 23.8% |
| Apache | 0.0 /100 | #331 | Tragic 23.8% |