Bangladeshi vs Italian Unemployment Among Women with Children Under 6 years
COMPARE
Bangladeshi
Italian
Unemployment Among Women with Children Under 6 years
Unemployment Among Women with Children Under 6 years Comparison
Bangladeshis
Italians
7.5%
UNEMPLOYMENT AMONG WOMEN WITH CHILDREN UNDER 6 YEARS
74.8/ 100
METRIC RATING
152nd/ 347
METRIC RANK
7.7%
UNEMPLOYMENT AMONG WOMEN WITH CHILDREN UNDER 6 YEARS
30.4/ 100
METRIC RATING
197th/ 347
METRIC RANK
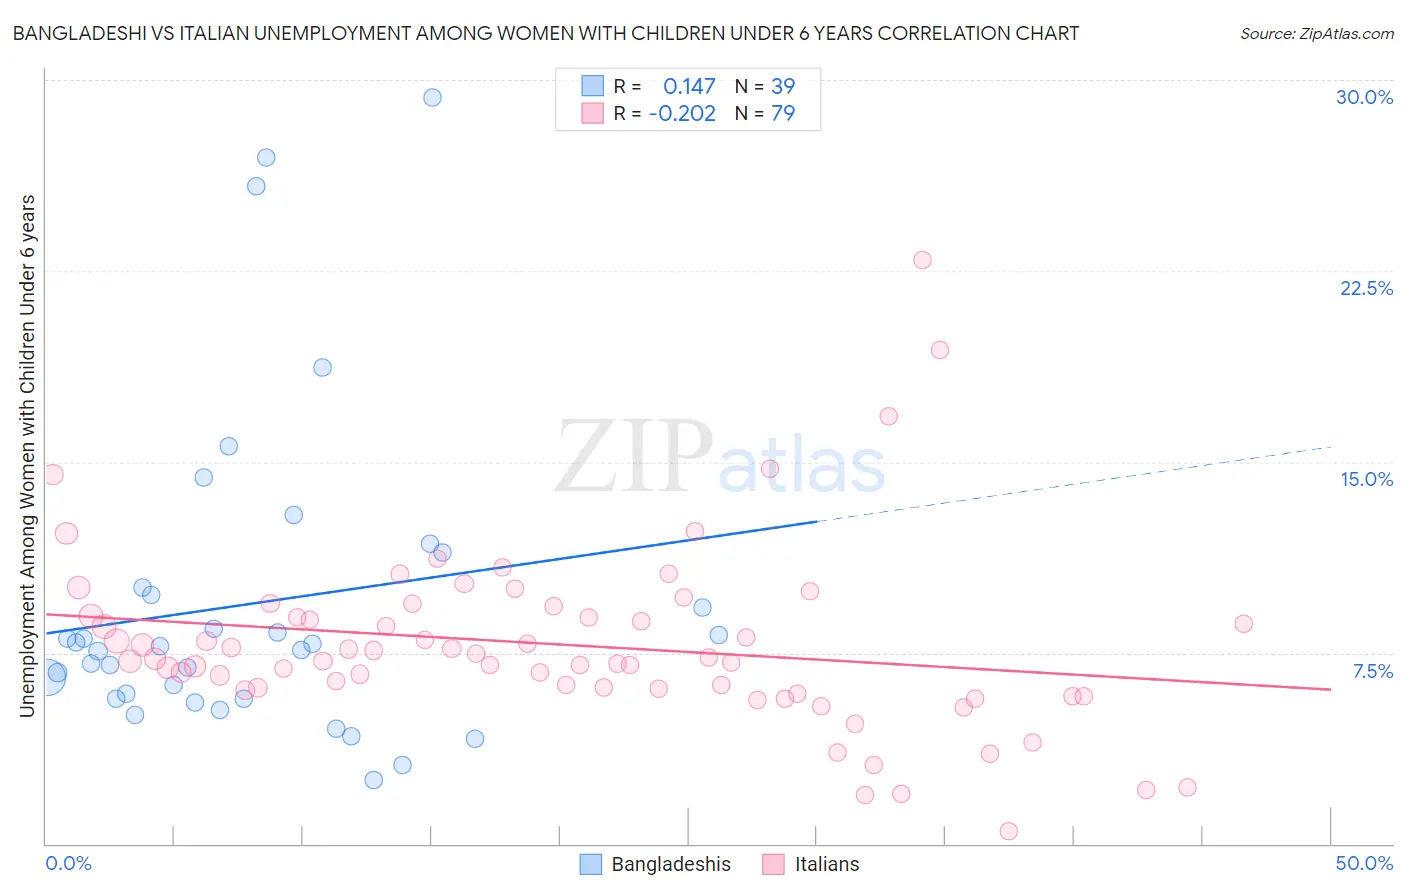
Bangladeshi vs Italian Unemployment Among Women with Children Under 6 years Correlation Chart
The statistical analysis conducted on geographies consisting of 122,945,375 people shows a poor positive correlation between the proportion of Bangladeshis and unemployment rate among women with children under the age of 6 in the United States with a correlation coefficient (R) of 0.147 and weighted average of 7.5%. Similarly, the statistical analysis conducted on geographies consisting of 378,978,882 people shows a weak negative correlation between the proportion of Italians and unemployment rate among women with children under the age of 6 in the United States with a correlation coefficient (R) of -0.202 and weighted average of 7.7%, a difference of 3.2%.
Unemployment Among Women with Children Under 6 years Correlation Summary
| Measurement | Bangladeshi | Italian |
| Minimum | 2.5% | 0.50% |
| Maximum | 29.3% | 22.9% |
| Range | 26.8% | 22.4% |
| Mean | 9.4% | 7.8% |
| Median | 7.7% | 7.3% |
| Interquartile 25% (IQ1) | 5.7% | 6.1% |
| Interquartile 75% (IQ3) | 10.1% | 8.9% |
| Interquartile Range (IQR) | 4.4% | 2.9% |
| Standard Deviation (Sample) | 6.2% | 3.6% |
| Standard Deviation (Population) | 6.1% | 3.5% |
Similar Demographics by Unemployment Among Women with Children Under 6 years
Demographics Similar to Bangladeshis by Unemployment Among Women with Children Under 6 years
In terms of unemployment among women with children under 6 years, the demographic groups most similar to Bangladeshis are Immigrants from Peru (7.5%, a difference of 0.010%), Uruguayan (7.5%, a difference of 0.010%), Northern European (7.5%, a difference of 0.040%), South American (7.5%, a difference of 0.060%), and Colombian (7.5%, a difference of 0.11%).
| Demographics | Rating | Rank | Unemployment Among Women with Children Under 6 years |
| Immigrants | Jordan | 78.9 /100 | #145 | Good 7.5% |
| Japanese | 78.9 /100 | #146 | Good 7.5% |
| Immigrants | Oceania | 78.4 /100 | #147 | Good 7.5% |
| Immigrants | Brazil | 77.3 /100 | #148 | Good 7.5% |
| Colombians | 76.1 /100 | #149 | Good 7.5% |
| Aleuts | 76.0 /100 | #150 | Good 7.5% |
| Immigrants | Peru | 74.9 /100 | #151 | Good 7.5% |
| Bangladeshis | 74.8 /100 | #152 | Good 7.5% |
| Uruguayans | 74.7 /100 | #153 | Good 7.5% |
| Northern Europeans | 74.3 /100 | #154 | Good 7.5% |
| South Americans | 74.1 /100 | #155 | Good 7.5% |
| Immigrants | Southern Europe | 73.2 /100 | #156 | Good 7.5% |
| Peruvians | 72.3 /100 | #157 | Good 7.5% |
| Croatians | 71.9 /100 | #158 | Good 7.5% |
| Immigrants | Philippines | 71.3 /100 | #159 | Good 7.5% |
Demographics Similar to Italians by Unemployment Among Women with Children Under 6 years
In terms of unemployment among women with children under 6 years, the demographic groups most similar to Italians are Lithuanian (7.8%, a difference of 0.030%), Immigrants from St. Vincent and the Grenadines (7.7%, a difference of 0.050%), Malaysian (7.7%, a difference of 0.060%), Syrian (7.7%, a difference of 0.11%), and Slavic (7.7%, a difference of 0.15%).
| Demographics | Rating | Rank | Unemployment Among Women with Children Under 6 years |
| Immigrants | North Macedonia | 34.4 /100 | #190 | Fair 7.7% |
| Immigrants | Austria | 32.4 /100 | #191 | Fair 7.7% |
| Immigrants | Africa | 32.4 /100 | #192 | Fair 7.7% |
| Slavs | 32.4 /100 | #193 | Fair 7.7% |
| Syrians | 31.9 /100 | #194 | Fair 7.7% |
| Malaysians | 31.1 /100 | #195 | Fair 7.7% |
| Immigrants | St. Vincent and the Grenadines | 31.1 /100 | #196 | Fair 7.7% |
| Italians | 30.4 /100 | #197 | Fair 7.7% |
| Lithuanians | 30.0 /100 | #198 | Fair 7.8% |
| Immigrants | Poland | 27.3 /100 | #199 | Fair 7.8% |
| Guamanians/Chamorros | 25.5 /100 | #200 | Fair 7.8% |
| Basques | 24.7 /100 | #201 | Fair 7.8% |
| Sudanese | 23.5 /100 | #202 | Fair 7.8% |
| Spaniards | 23.3 /100 | #203 | Fair 7.8% |
| Lebanese | 22.2 /100 | #204 | Fair 7.8% |