Immigrants from England vs Italian Male Poverty
COMPARE
Immigrants from England
Italian
Male Poverty
Male Poverty Comparison
Immigrants from England
Italians
10.4%
MALE POVERTY
95.5/ 100
METRIC RATING
85th/ 347
METRIC RANK
9.6%
MALE POVERTY
99.7/ 100
METRIC RATING
23rd/ 347
METRIC RANK
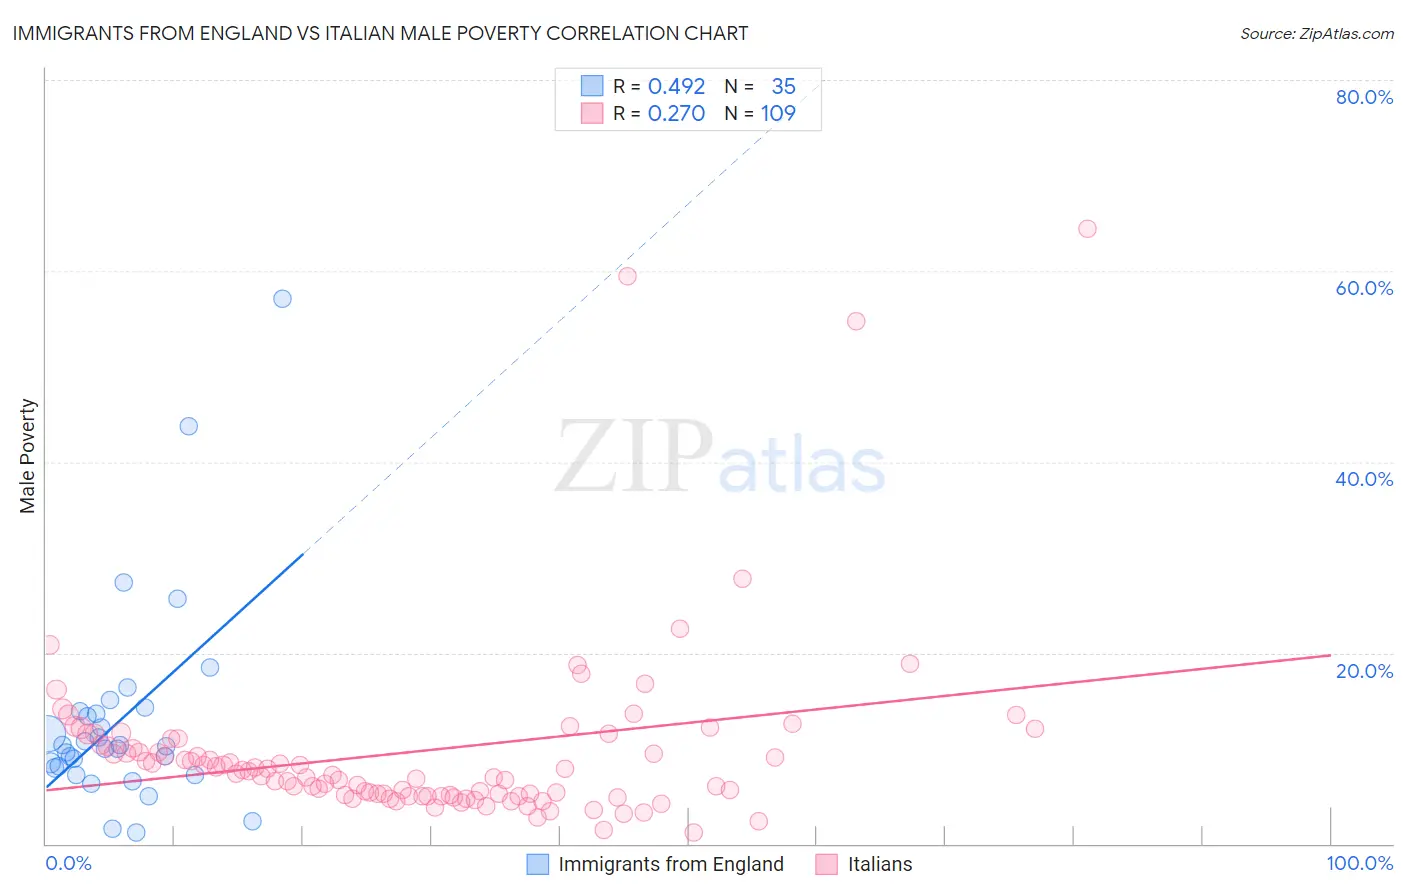
Immigrants from England vs Italian Male Poverty Correlation Chart
The statistical analysis conducted on geographies consisting of 391,609,977 people shows a moderate positive correlation between the proportion of Immigrants from England and poverty level among males in the United States with a correlation coefficient (R) of 0.492 and weighted average of 10.4%. Similarly, the statistical analysis conducted on geographies consisting of 573,221,501 people shows a weak positive correlation between the proportion of Italians and poverty level among males in the United States with a correlation coefficient (R) of 0.270 and weighted average of 9.6%, a difference of 7.6%.
Male Poverty Correlation Summary
| Measurement | Immigrants from England | Italian |
| Minimum | 1.2% | 1.2% |
| Maximum | 57.1% | 64.4% |
| Range | 55.9% | 63.1% |
| Mean | 13.0% | 9.6% |
| Median | 10.2% | 7.3% |
| Interquartile 25% (IQ1) | 7.9% | 5.1% |
| Interquartile 75% (IQ3) | 13.9% | 10.7% |
| Interquartile Range (IQR) | 5.9% | 5.6% |
| Standard Deviation (Sample) | 11.0% | 9.6% |
| Standard Deviation (Population) | 10.8% | 9.5% |
Similar Demographics by Male Poverty
Demographics Similar to Immigrants from England by Male Poverty
In terms of male poverty, the demographic groups most similar to Immigrants from England are Czechoslovakian (10.3%, a difference of 0.050%), Immigrants from Sweden (10.3%, a difference of 0.11%), Immigrants from Eastern Asia (10.4%, a difference of 0.13%), Northern European (10.4%, a difference of 0.17%), and Egyptian (10.3%, a difference of 0.23%).
| Demographics | Rating | Rank | Male Poverty |
| Irish | 96.8 /100 | #78 | Exceptional 10.3% |
| Immigrants | North America | 96.5 /100 | #79 | Exceptional 10.3% |
| English | 96.4 /100 | #80 | Exceptional 10.3% |
| Belgians | 95.9 /100 | #81 | Exceptional 10.3% |
| Egyptians | 95.9 /100 | #82 | Exceptional 10.3% |
| Immigrants | Sweden | 95.7 /100 | #83 | Exceptional 10.3% |
| Czechoslovakians | 95.6 /100 | #84 | Exceptional 10.3% |
| Immigrants | England | 95.5 /100 | #85 | Exceptional 10.4% |
| Immigrants | Eastern Asia | 95.3 /100 | #86 | Exceptional 10.4% |
| Northern Europeans | 95.2 /100 | #87 | Exceptional 10.4% |
| Cambodians | 95.0 /100 | #88 | Exceptional 10.4% |
| Immigrants | Denmark | 95.0 /100 | #89 | Exceptional 10.4% |
| Indians (Asian) | 94.9 /100 | #90 | Exceptional 10.4% |
| British | 94.8 /100 | #91 | Exceptional 10.4% |
| Jordanians | 94.4 /100 | #92 | Exceptional 10.4% |
Demographics Similar to Italians by Male Poverty
In terms of male poverty, the demographic groups most similar to Italians are Croatian (9.6%, a difference of 0.010%), Swedish (9.6%, a difference of 0.080%), Eastern European (9.6%, a difference of 0.22%), Immigrants from Scotland (9.6%, a difference of 0.26%), and Latvian (9.6%, a difference of 0.52%).
| Demographics | Rating | Rank | Male Poverty |
| Luxembourgers | 99.8 /100 | #16 | Exceptional 9.5% |
| Norwegians | 99.8 /100 | #17 | Exceptional 9.5% |
| Lithuanians | 99.8 /100 | #18 | Exceptional 9.5% |
| Immigrants | Hong Kong | 99.7 /100 | #19 | Exceptional 9.6% |
| Latvians | 99.7 /100 | #20 | Exceptional 9.6% |
| Immigrants | Scotland | 99.7 /100 | #21 | Exceptional 9.6% |
| Croatians | 99.7 /100 | #22 | Exceptional 9.6% |
| Italians | 99.7 /100 | #23 | Exceptional 9.6% |
| Swedes | 99.7 /100 | #24 | Exceptional 9.6% |
| Eastern Europeans | 99.6 /100 | #25 | Exceptional 9.6% |
| Burmese | 99.6 /100 | #26 | Exceptional 9.7% |
| Danes | 99.6 /100 | #27 | Exceptional 9.7% |
| Immigrants | Korea | 99.6 /100 | #28 | Exceptional 9.7% |
| Greeks | 99.6 /100 | #29 | Exceptional 9.7% |
| Poles | 99.5 /100 | #30 | Exceptional 9.7% |