Bangladeshi vs Salvadoran Receiving Food Stamps
COMPARE
Bangladeshi
Salvadoran
Receiving Food Stamps
Receiving Food Stamps Comparison
Bangladeshis
Salvadorans
15.0%
RECEIVING FOOD STAMPS
0.0/ 100
METRIC RATING
283rd/ 347
METRIC RANK
13.2%
RECEIVING FOOD STAMPS
2.7/ 100
METRIC RATING
232nd/ 347
METRIC RANK
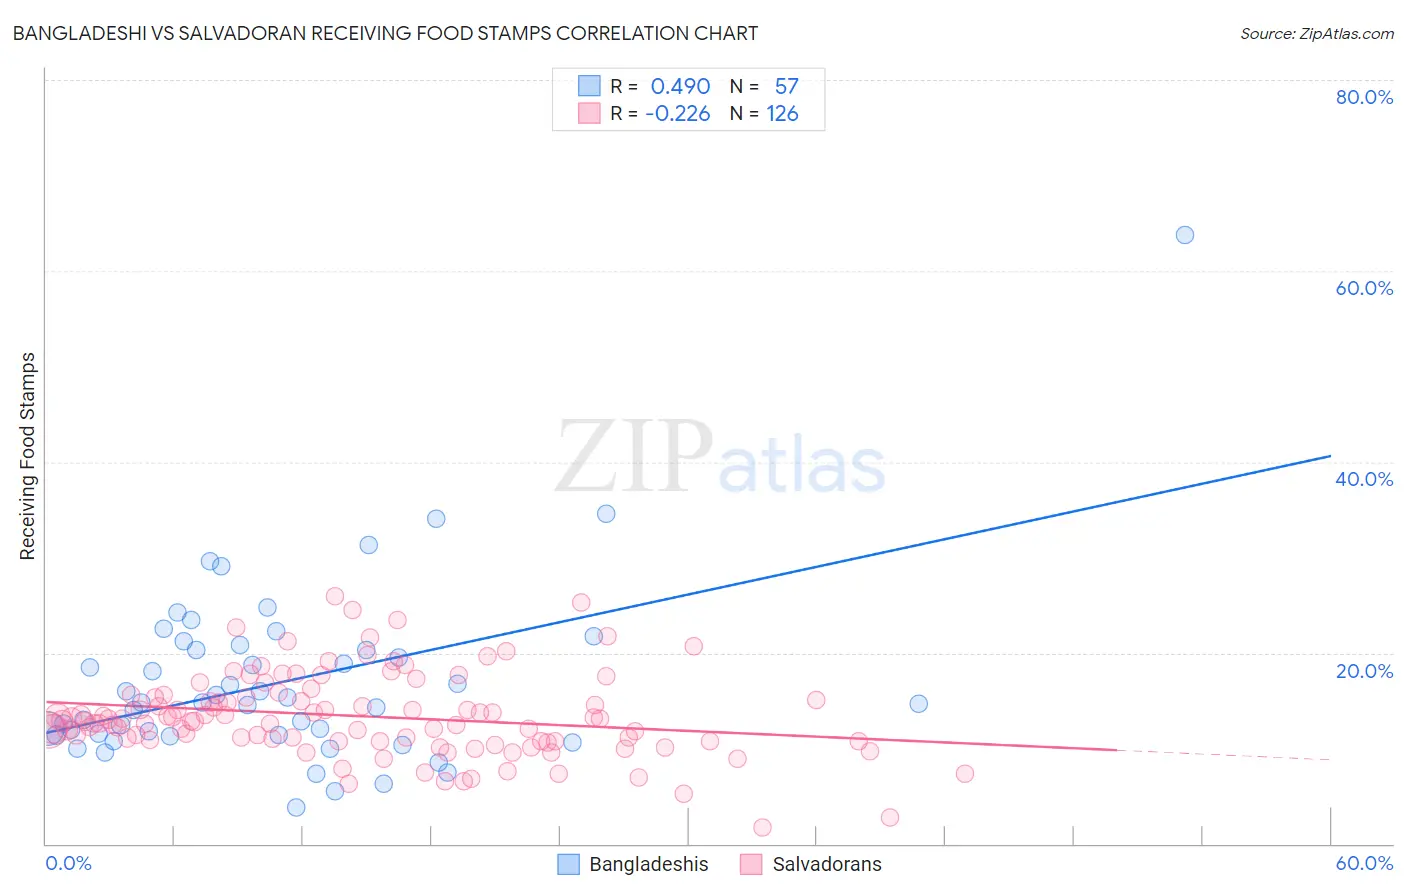
Bangladeshi vs Salvadoran Receiving Food Stamps Correlation Chart
The statistical analysis conducted on geographies consisting of 141,258,280 people shows a moderate positive correlation between the proportion of Bangladeshis and percentage of population receiving government assistance and/or food stamps in the United States with a correlation coefficient (R) of 0.490 and weighted average of 15.0%. Similarly, the statistical analysis conducted on geographies consisting of 398,082,063 people shows a weak negative correlation between the proportion of Salvadorans and percentage of population receiving government assistance and/or food stamps in the United States with a correlation coefficient (R) of -0.226 and weighted average of 13.2%, a difference of 13.9%.
Receiving Food Stamps Correlation Summary
| Measurement | Bangladeshi | Salvadoran |
| Minimum | 3.8% | 1.7% |
| Maximum | 63.8% | 25.9% |
| Range | 60.0% | 24.2% |
| Mean | 16.9% | 13.4% |
| Median | 14.7% | 12.9% |
| Interquartile 25% (IQ1) | 11.4% | 10.8% |
| Interquartile 75% (IQ3) | 20.6% | 15.3% |
| Interquartile Range (IQR) | 9.2% | 4.5% |
| Standard Deviation (Sample) | 9.4% | 4.4% |
| Standard Deviation (Population) | 9.3% | 4.3% |
Similar Demographics by Receiving Food Stamps
Demographics Similar to Bangladeshis by Receiving Food Stamps
In terms of receiving food stamps, the demographic groups most similar to Bangladeshis are Immigrants from Ecuador (15.0%, a difference of 0.010%), Immigrants from Central America (15.0%, a difference of 0.28%), Immigrants from Liberia (15.1%, a difference of 0.39%), African (15.1%, a difference of 0.53%), and Immigrants from Mexico (15.2%, a difference of 0.76%).
| Demographics | Rating | Rank | Receiving Food Stamps |
| Liberians | 0.1 /100 | #276 | Tragic 14.8% |
| Seminole | 0.1 /100 | #277 | Tragic 14.8% |
| Belizeans | 0.1 /100 | #278 | Tragic 14.8% |
| Kiowa | 0.0 /100 | #279 | Tragic 14.9% |
| Ecuadorians | 0.0 /100 | #280 | Tragic 14.9% |
| Spanish American Indians | 0.0 /100 | #281 | Tragic 14.9% |
| Immigrants | Central America | 0.0 /100 | #282 | Tragic 15.0% |
| Bangladeshis | 0.0 /100 | #283 | Tragic 15.0% |
| Immigrants | Ecuador | 0.0 /100 | #284 | Tragic 15.0% |
| Immigrants | Liberia | 0.0 /100 | #285 | Tragic 15.1% |
| Africans | 0.0 /100 | #286 | Tragic 15.1% |
| Immigrants | Mexico | 0.0 /100 | #287 | Tragic 15.2% |
| Immigrants | Belize | 0.0 /100 | #288 | Tragic 15.2% |
| Immigrants | Senegal | 0.0 /100 | #289 | Tragic 15.3% |
| Senegalese | 0.0 /100 | #290 | Tragic 15.4% |
Demographics Similar to Salvadorans by Receiving Food Stamps
In terms of receiving food stamps, the demographic groups most similar to Salvadorans are Cherokee (13.2%, a difference of 0.26%), Comanche (13.3%, a difference of 0.38%), Immigrants from Nigeria (13.1%, a difference of 0.73%), Puget Sound Salish (13.1%, a difference of 0.77%), and Ottawa (13.1%, a difference of 0.82%).
| Demographics | Rating | Rank | Receiving Food Stamps |
| Fijians | 4.3 /100 | #225 | Tragic 13.0% |
| Chickasaw | 3.6 /100 | #226 | Tragic 13.1% |
| Nigerians | 3.5 /100 | #227 | Tragic 13.1% |
| Panamanians | 3.5 /100 | #228 | Tragic 13.1% |
| Ottawa | 3.5 /100 | #229 | Tragic 13.1% |
| Puget Sound Salish | 3.4 /100 | #230 | Tragic 13.1% |
| Immigrants | Nigeria | 3.4 /100 | #231 | Tragic 13.1% |
| Salvadorans | 2.7 /100 | #232 | Tragic 13.2% |
| Cherokee | 2.5 /100 | #233 | Tragic 13.2% |
| Comanche | 2.4 /100 | #234 | Tragic 13.3% |
| Immigrants | Zaire | 1.9 /100 | #235 | Tragic 13.4% |
| Crow | 1.6 /100 | #236 | Tragic 13.4% |
| Immigrants | El Salvador | 1.5 /100 | #237 | Tragic 13.5% |
| French American Indians | 1.4 /100 | #238 | Tragic 13.5% |
| Immigrants | Micronesia | 1.3 /100 | #239 | Tragic 13.5% |