Northern European vs Immigrants from India Family Poverty

COMPARE

Northern European
Race
Ancestry
AfghanAfricanAlaska NativeAlaskan AthabascanAlbanianAleutAlsatianAmericanApacheArabArapahoArgentineanArmenianAssyrian/Chaldean/SyriacAustralianAustrianBahamianBangladeshiBarbadianBasqueBelgianBelizeanBermudanBhutaneseBlackfeetBolivianBrazilianBritishBritish West IndianBulgarianBurmeseCajunCambodianCanadianCape VerdeanCarpatho RusynCelticCentral AmericanCentral American IndianCherokeeCheyenneChickasawChileanChineseChippewaChoctawColombianColvilleComancheCosta RicanCreeCreekCroatianCrowCubanCypriotCzechCzechoslovakianDanishDelawareDominicanDutchDutch West IndianEastern EuropeanEcuadorianEgyptianEnglishEstonianEthiopianEuropeanFijianFilipinoFinnishFrenchFrench American IndianFrench CanadianGermanGerman RussianGhanaianGreekGuamanian/ChamorroGuatemalanGuyaneseHaitianHmongHonduranHopiHoumaHungarianIcelanderIndian (Asian)IndonesianInupiatIranianIraqiIrishIroquoisIsraeliItalianJamaicanJapaneseJordanianKenyanKiowaKoreanLaotianLatvianLebaneseLiberianLithuanianLumbeeLuxembourgerMacedonianMalaysianMalteseMarshalleseMenomineeMexicanMexican American IndianMongolianMoroccanNative HawaiianNavajoNepaleseNew ZealanderNicaraguanNigerianNorthern EuropeanNorwegianOkinawanOsageOttawaPaiutePakistaniPalestinianPanamanianParaguayanPennsylvania GermanPeruvianPimaPolishPortuguesePotawatomiPuebloPuerto RicanPuget Sound SalishRomanianRussianSalvadoranSamoanScandinavianScotch-IrishScottishSeminoleSenegaleseSerbianShoshoneSierra LeoneanSiouxSlavicSlovakSloveneSomaliSouth AfricanSouth AmericanSouth American IndianSoviet UnionSpaniardSpanishSpanish AmericanSpanish American IndianSri LankanSubsaharan AfricanSudaneseSwedishSwissSyrianTaiwaneseThaiTlingit-HaidaTohono O'OdhamTonganTrinidadian and TobagonianTsimshianTurkishU.S. Virgin IslanderUgandanUkrainianUruguayanUteVenezuelanVietnameseWelshWest IndianYakamaYaquiYugoslavianYumanYup'ikZimbabwean
Immigration
NonimmigrantsImmigrantsAfghanistanAfricaAlbaniaArgentinaArmeniaAsiaAustraliaAustriaBahamasBangladeshBarbadosBelarusBelgiumBelizeBoliviaBosnia and HerzegovinaBrazilBulgariaBurma/MyanmarCabo VerdeCambodiaCameroonCanadaCaribbeanCentral AmericaChileChinaColombiaCongoCosta RicaCroatiaCubaCzechoslovakiaDenmarkDominicaDominican RepublicEastern AfricaEastern AsiaEastern EuropeEcuadorEgyptEl SalvadorEnglandEritreaEthiopiaEuropeFijiFranceGermanyGhanaGreeceGrenadaGuatemalaGuyanaHaitiHondurasHong KongHungaryIndonesiaIranIraqIrelandIsraelItalyJamaicaJapanJordanKazakhstanKenyaKoreaKuwaitLaosLatin AmericaLatviaLebanonLiberiaLithuaniaMalaysiaMexicoMicronesiaMiddle AfricaMoldovaMoroccoNepalNetherlandsNicaraguaNigeriaNorth AmericaNorth MacedoniaNorthern AfricaNorthern EuropeNorwayOceaniaPakistanPanamaPeruPhilippinesPolandPortugalRomaniaRussiaSaudi ArabiaScotlandSenegalSerbiaSierra LeoneSingaporeSomaliaSouth AfricaSouth AmericaSouth Central AsiaSouth Eastern AsiaSouthern EuropeSpainSri LankaSt. Vincent and the GrenadinesSudanSwedenSwitzerlandSyriaTaiwanThailandTrinidad and TobagoTurkeyUgandaUkraineUruguayUzbekistanVenezuelaVietnamWest IndiesWestern AfricaWestern AsiaWestern EuropeYemenZaireZimbabweAzores
Immigrants from India
Race
Ancestry
AfghanAfricanAlaska NativeAlaskan AthabascanAlbanianAleutAlsatianAmericanApacheArabArapahoArgentineanArmenianAssyrian/Chaldean/SyriacAustralianAustrianBahamianBangladeshiBarbadianBasqueBelgianBelizeanBermudanBhutaneseBlackfeetBolivianBrazilianBritishBritish West IndianBulgarianBurmeseCajunCambodianCanadianCape VerdeanCarpatho RusynCelticCentral AmericanCentral American IndianCherokeeCheyenneChickasawChileanChineseChippewaChoctawColombianColvilleComancheCosta RicanCreeCreekCroatianCrowCubanCypriotCzechCzechoslovakianDanishDelawareDominicanDutchDutch West IndianEastern EuropeanEcuadorianEgyptianEnglishEstonianEthiopianEuropeanFijianFilipinoFinnishFrenchFrench American IndianFrench CanadianGermanGerman RussianGhanaianGreekGuamanian/ChamorroGuatemalanGuyaneseHaitianHmongHonduranHopiHoumaHungarianIcelanderIndian (Asian)IndonesianInupiatIranianIraqiIrishIroquoisIsraeliItalianJamaicanJapaneseJordanianKenyanKiowaKoreanLaotianLatvianLebaneseLiberianLithuanianLumbeeLuxembourgerMacedonianMalaysianMalteseMarshalleseMenomineeMexicanMexican American IndianMongolianMoroccanNative HawaiianNavajoNepaleseNew ZealanderNicaraguanNigerianNorwegianOkinawanOsageOttawaPaiutePakistaniPalestinianPanamanianParaguayanPennsylvania GermanPeruvianPimaPolishPortuguesePotawatomiPuebloPuerto RicanPuget Sound SalishRomanianRussianSalvadoranSamoanScandinavianScotch-IrishScottishSeminoleSenegaleseSerbianShoshoneSierra LeoneanSiouxSlavicSlovakSloveneSomaliSouth AfricanSouth AmericanSouth American IndianSoviet UnionSpaniardSpanishSpanish AmericanSpanish American IndianSri LankanSubsaharan AfricanSudaneseSwedishSwissSyrianTaiwaneseThaiTlingit-HaidaTohono O'OdhamTonganTrinidadian and TobagonianTsimshianTurkishU.S. Virgin IslanderUgandanUkrainianUruguayanUteVenezuelanVietnameseWelshWest IndianYakamaYaquiYugoslavianYumanYup'ikZimbabwean
Immigration
NonimmigrantsImmigrantsAfghanistanAfricaAlbaniaArgentinaArmeniaAsiaAustraliaAustriaBahamasBangladeshBarbadosBelarusBelgiumBelizeBoliviaBosnia and HerzegovinaBrazilBulgariaBurma/MyanmarCabo VerdeCambodiaCameroonCanadaCaribbeanCentral AmericaChileChinaColombiaCongoCosta RicaCroatiaCubaCzechoslovakiaDenmarkDominicaDominican RepublicEastern AfricaEastern AsiaEastern EuropeEcuadorEgyptEl SalvadorEnglandEritreaEthiopiaEuropeFijiFranceGermanyGhanaGreeceGrenadaGuatemalaGuyanaHaitiHondurasHong KongHungaryIndiaIndonesiaIranIraqIrelandIsraelItalyJamaicaJapanJordanKazakhstanKenyaKoreaKuwaitLaosLatin AmericaLatviaLebanonLiberiaLithuaniaMalaysiaMexicoMicronesiaMiddle AfricaMoldovaMoroccoNepalNetherlandsNicaraguaNigeriaNorth AmericaNorth MacedoniaNorthern AfricaNorthern EuropeNorwayOceaniaPakistanPanamaPeruPhilippinesPolandPortugalRomaniaRussiaSaudi ArabiaScotlandSenegalSerbiaSierra LeoneSingaporeSomaliaSouth AfricaSouth AmericaSouth Central AsiaSouth Eastern AsiaSouthern EuropeSpainSri LankaSt. Vincent and the GrenadinesSudanSwedenSwitzerlandSyriaTaiwanThailandTrinidad and TobagoTurkeyUgandaUkraineUruguayUzbekistanVenezuelaVietnamWest IndiesWestern AfricaWestern AsiaWestern EuropeYemenZaireZimbabweAzores
Family Poverty
Income
Poverty
Unemployment
Labor Participation
Family Structure
Vehicle Availability
Education Level
Disability

Family Poverty Comparison

Northern Europeans

Immigrants from India

Exceptional
Exceptional
7.8%
FAMILY POVERTY
98.3/ 100
METRIC RATING
67th/ 347
METRIC RANK
6.2%
FAMILY POVERTY
100.0/ 100
METRIC RATING
1st/ 347
METRIC RANK

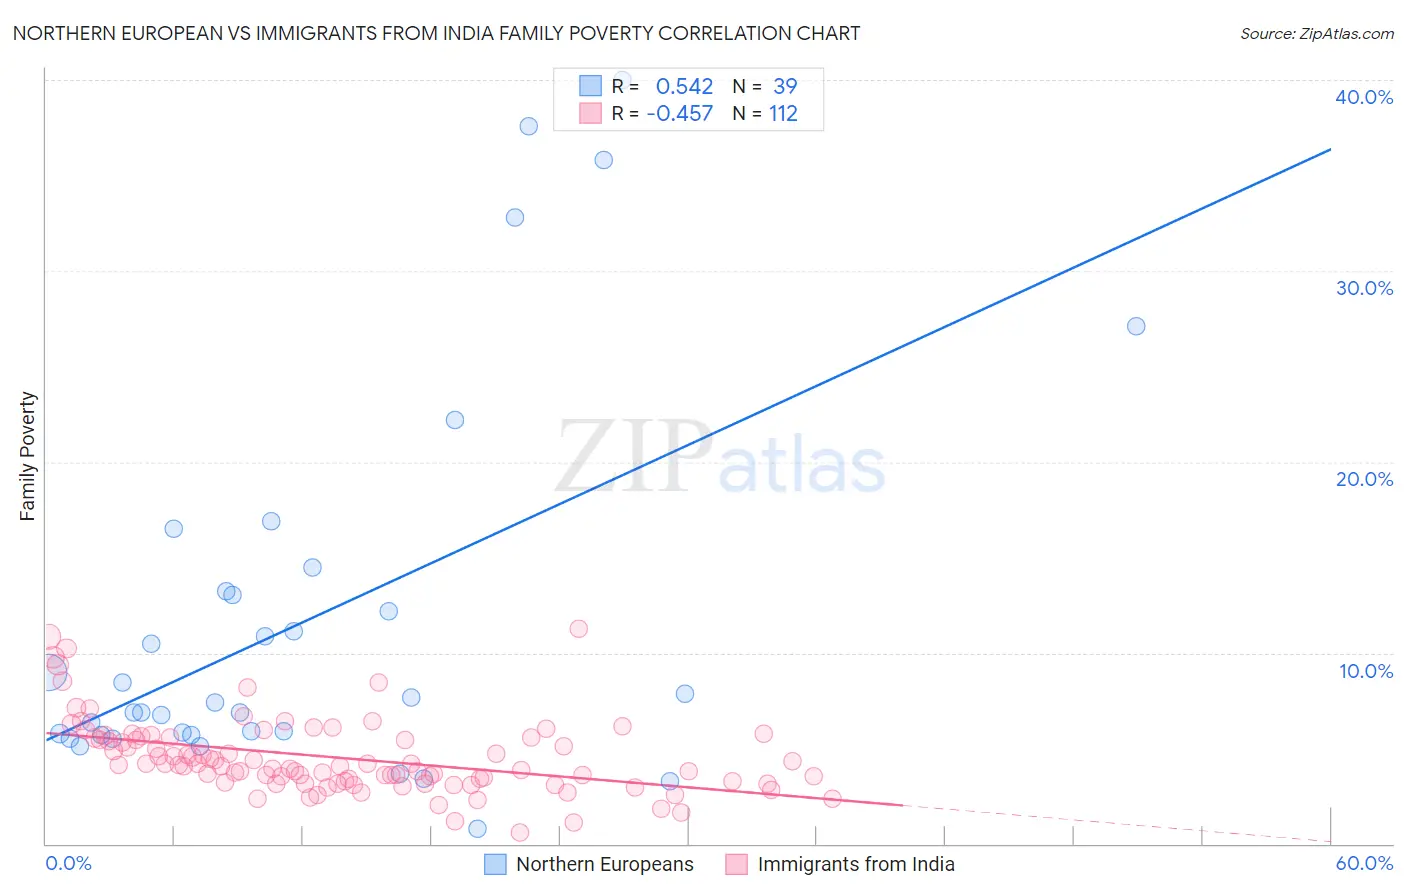
Northern European vs Immigrants from India Family Poverty Correlation Chart

The statistical analysis conducted on geographies consisting of 404,830,056 people shows a substantial positive correlation between the proportion of Northern Europeans and poverty level among families in the United States with a correlation coefficient (R) of 0.542 and weighted average of 7.8%. Similarly, the statistical analysis conducted on geographies consisting of 432,464,451 people shows a moderate negative correlation between the proportion of Immigrants from India and poverty level among families in the United States with a correlation coefficient (R) of -0.457 and weighted average of 6.2%, a difference of 25.4%.
Northern European vs Immigrants from India Family Poverty

Family Poverty Correlation Summary

MeasurementNorthern EuropeanImmigrants from India
Minimum0.78%0.60%
Maximum40.0%11.3%
Range39.2%10.7%
Mean11.7%4.5%
Median7.4%4.1%
Interquartile 25% (IQ1)5.7%3.2%
Interquartile 75% (IQ3)13.2%5.5%
Interquartile Range (IQR)7.5%2.3%
Standard Deviation (Sample)10.0%1.9%
Standard Deviation (Population)9.9%1.9%

Similar Demographics by Family Poverty

Demographics Similar to Northern Europeans by Family Poverty

In terms of family poverty, the demographic groups most similar to Northern Europeans are Dutch (7.8%, a difference of 0.010%), Australian (7.8%, a difference of 0.030%), Immigrants from Belgium (7.8%, a difference of 0.050%), Immigrants from Bulgaria (7.8%, a difference of 0.070%), and Korean (7.8%, a difference of 0.080%).
DemographicsRating | RankFamily Poverty
Immigrants | Greece
98.7
/100
|
#60
Exceptional
7.7%
Immigrants | Netherlands
98.6
/100
|
#61
Exceptional
7.7%
Macedonians
98.6
/100
|
#62
Exceptional
7.8%
Zimbabweans
98.4
/100
|
#63
Exceptional
7.8%
Koreans
98.3
/100
|
#64
Exceptional
7.8%
Immigrants | Bulgaria
98.3
/100
|
#65
Exceptional
7.8%
Dutch
98.3
/100
|
#66
Exceptional
7.8%
Northern Europeans
98.3
/100
|
#67
Exceptional
7.8%
Australians
98.2
/100
|
#68
Exceptional
7.8%
Immigrants | Belgium
98.2
/100
|
#69
Exceptional
7.8%
Immigrants | Canada
98.2
/100
|
#70
Exceptional
7.8%
Cambodians
98.2
/100
|
#71
Exceptional
7.8%
Immigrants | Romania
98.2
/100
|
#72
Exceptional
7.8%
Austrians
98.2
/100
|
#73
Exceptional
7.8%
Immigrants | China
98.1
/100
|
#74
Exceptional
7.8%

Demographics Similar to Immigrants from India by Family Poverty

In terms of family poverty, the demographic groups most similar to Immigrants from India are Chinese (6.5%, a difference of 4.3%), Immigrants from Taiwan (6.6%, a difference of 6.0%), Filipino (6.6%, a difference of 6.6%), Thai (6.7%, a difference of 7.2%), and Norwegian (6.9%, a difference of 10.5%).
DemographicsRating | RankFamily Poverty
Immigrants | India
100.0
/100
|
#1
Exceptional
6.2%
Chinese
100.0
/100
|
#2
Exceptional
6.5%
Immigrants | Taiwan
100.0
/100
|
#3
Exceptional
6.6%
Filipinos
100.0
/100
|
#4
Exceptional
6.6%
Thais
100.0
/100
|
#5
Exceptional
6.7%
Norwegians
99.9
/100
|
#6
Exceptional
6.9%
Immigrants | Ireland
99.9
/100
|
#7
Exceptional
7.0%
Bhutanese
99.9
/100
|
#8
Exceptional
7.0%
Latvians
99.9
/100
|
#9
Exceptional
7.1%
Bulgarians
99.8
/100
|
#10
Exceptional
7.1%
Immigrants | Singapore
99.8
/100
|
#11
Exceptional
7.1%
Maltese
99.8
/100
|
#12
Exceptional
7.1%
Swedes
99.8
/100
|
#13
Exceptional
7.1%
Iranians
99.8
/100
|
#14
Exceptional
7.1%
Lithuanians
99.8
/100
|
#15
Exceptional
7.2%