Bahamian vs Aleut Male Poverty
COMPARE
Bahamian
Aleut
Male Poverty
Male Poverty Comparison
Bahamians
Aleuts
14.1%
MALE POVERTY
0.0/ 100
METRIC RATING
303rd/ 347
METRIC RANK
11.8%
MALE POVERTY
10.4/ 100
METRIC RATING
202nd/ 347
METRIC RANK
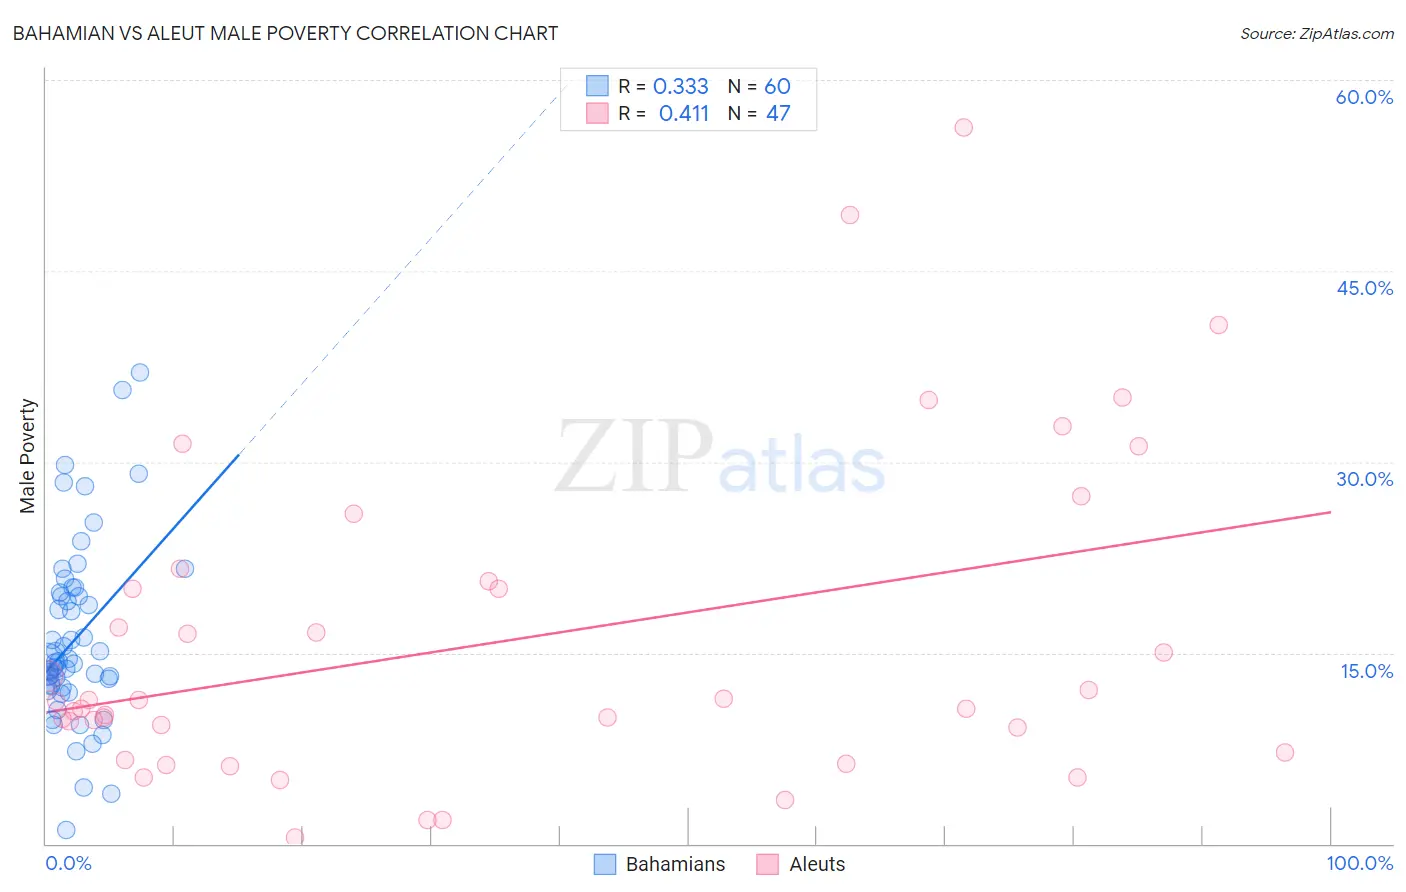
Bahamian vs Aleut Male Poverty Correlation Chart
The statistical analysis conducted on geographies consisting of 112,626,809 people shows a mild positive correlation between the proportion of Bahamians and poverty level among males in the United States with a correlation coefficient (R) of 0.333 and weighted average of 14.1%. Similarly, the statistical analysis conducted on geographies consisting of 61,774,316 people shows a moderate positive correlation between the proportion of Aleuts and poverty level among males in the United States with a correlation coefficient (R) of 0.411 and weighted average of 11.8%, a difference of 19.3%.
Male Poverty Correlation Summary
| Measurement | Bahamian | Aleut |
| Minimum | 1.1% | 0.53% |
| Maximum | 37.0% | 56.2% |
| Range | 35.9% | 55.7% |
| Mean | 16.1% | 15.9% |
| Median | 14.3% | 11.2% |
| Interquartile 25% (IQ1) | 12.3% | 7.1% |
| Interquartile 75% (IQ3) | 19.6% | 20.6% |
| Interquartile Range (IQR) | 7.3% | 13.5% |
| Standard Deviation (Sample) | 7.1% | 12.6% |
| Standard Deviation (Population) | 7.0% | 12.4% |
Similar Demographics by Male Poverty
Demographics Similar to Bahamians by Male Poverty
In terms of male poverty, the demographic groups most similar to Bahamians are Immigrants from Caribbean (14.0%, a difference of 0.040%), Immigrants from Senegal (14.0%, a difference of 0.10%), Senegalese (14.1%, a difference of 0.10%), Immigrants from Mexico (14.0%, a difference of 0.17%), and Immigrants from Guatemala (14.0%, a difference of 0.28%).
| Demographics | Rating | Rank | Male Poverty |
| Cajuns | 0.0 /100 | #296 | Tragic 13.9% |
| Inupiat | 0.0 /100 | #297 | Tragic 14.0% |
| Blackfeet | 0.0 /100 | #298 | Tragic 14.0% |
| Immigrants | Guatemala | 0.0 /100 | #299 | Tragic 14.0% |
| Immigrants | Mexico | 0.0 /100 | #300 | Tragic 14.0% |
| Immigrants | Senegal | 0.0 /100 | #301 | Tragic 14.0% |
| Immigrants | Caribbean | 0.0 /100 | #302 | Tragic 14.0% |
| Bahamians | 0.0 /100 | #303 | Tragic 14.1% |
| Senegalese | 0.0 /100 | #304 | Tragic 14.1% |
| Immigrants | Bangladesh | 0.0 /100 | #305 | Tragic 14.1% |
| Creek | 0.0 /100 | #306 | Tragic 14.1% |
| Dutch West Indians | 0.0 /100 | #307 | Tragic 14.2% |
| Africans | 0.0 /100 | #308 | Tragic 14.2% |
| Somalis | 0.0 /100 | #309 | Tragic 14.3% |
| Seminole | 0.0 /100 | #310 | Tragic 14.3% |
Demographics Similar to Aleuts by Male Poverty
In terms of male poverty, the demographic groups most similar to Aleuts are Immigrants from Western Asia (11.8%, a difference of 0.14%), Immigrants from Uganda (11.8%, a difference of 0.50%), Spaniard (11.7%, a difference of 0.71%), Immigrants from Lebanon (11.7%, a difference of 0.72%), and Spanish (11.7%, a difference of 0.82%).
| Demographics | Rating | Rank | Male Poverty |
| Arabs | 15.8 /100 | #195 | Poor 11.6% |
| Hmong | 15.8 /100 | #196 | Poor 11.6% |
| Delaware | 15.4 /100 | #197 | Poor 11.7% |
| Iraqis | 14.7 /100 | #198 | Poor 11.7% |
| Spanish | 14.1 /100 | #199 | Poor 11.7% |
| Immigrants | Lebanon | 13.6 /100 | #200 | Poor 11.7% |
| Spaniards | 13.5 /100 | #201 | Poor 11.7% |
| Aleuts | 10.4 /100 | #202 | Poor 11.8% |
| Immigrants | Western Asia | 9.8 /100 | #203 | Tragic 11.8% |
| Immigrants | Uganda | 8.5 /100 | #204 | Tragic 11.8% |
| Panamanians | 6.2 /100 | #205 | Tragic 11.9% |
| Immigrants | Eastern Africa | 5.4 /100 | #206 | Tragic 12.0% |
| Malaysians | 5.2 /100 | #207 | Tragic 12.0% |
| Immigrants | Immigrants | 4.5 /100 | #208 | Tragic 12.0% |
| Immigrants | Azores | 4.3 /100 | #209 | Tragic 12.0% |