Immigrants from Liberia vs Immigrants from Czechoslovakia Family Poverty
COMPARE
Immigrants from Liberia
Immigrants from Czechoslovakia
Family Poverty
Family Poverty Comparison
Immigrants from Liberia
Immigrants from Czechoslovakia
10.8%
FAMILY POVERTY
0.2/ 100
METRIC RATING
255th/ 347
METRIC RANK
7.7%
FAMILY POVERTY
98.9/ 100
METRIC RATING
47th/ 347
METRIC RANK
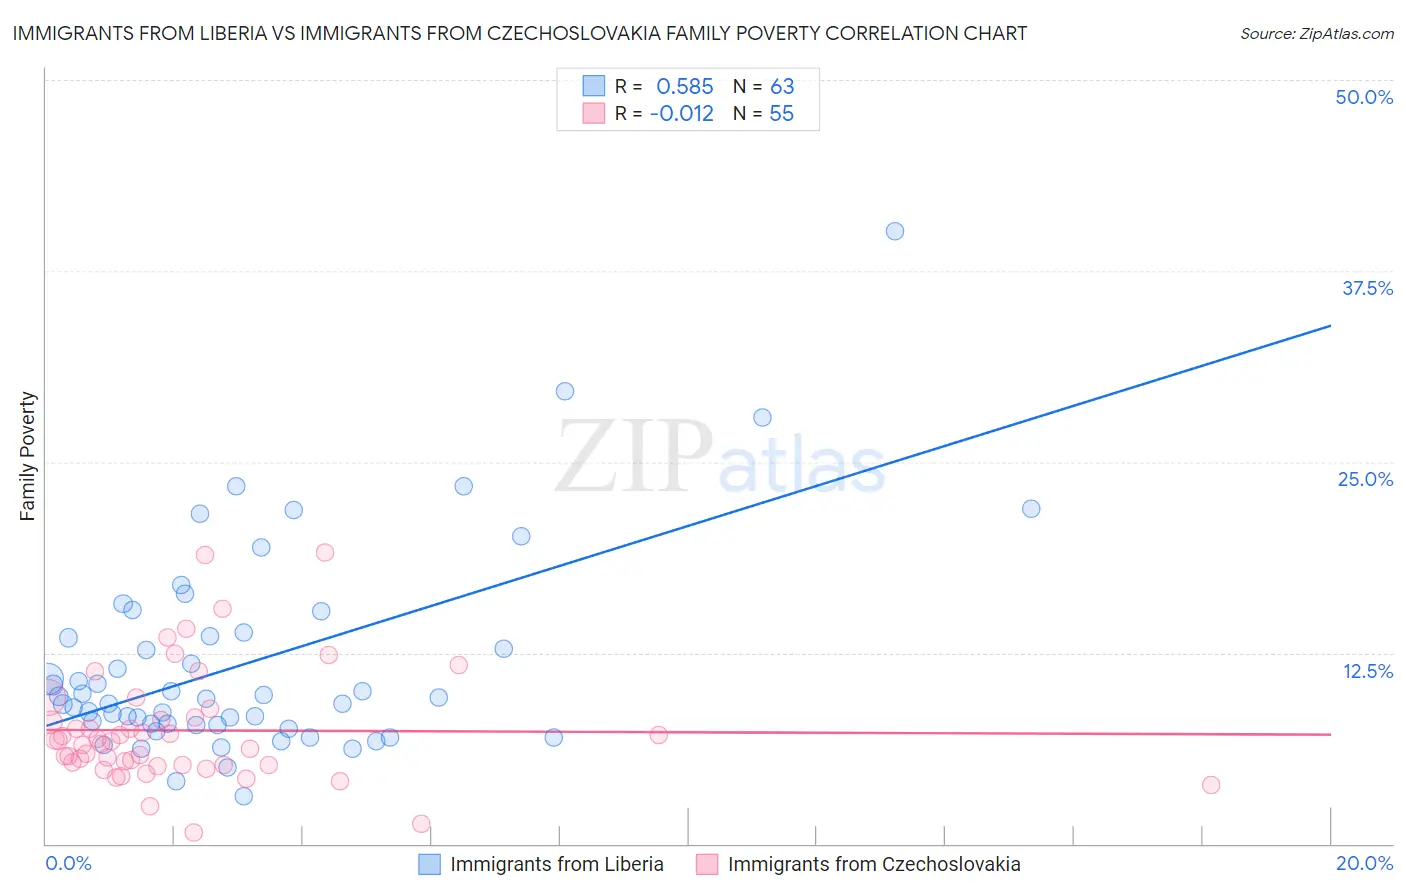
Immigrants from Liberia vs Immigrants from Czechoslovakia Family Poverty Correlation Chart
The statistical analysis conducted on geographies consisting of 135,184,573 people shows a substantial positive correlation between the proportion of Immigrants from Liberia and poverty level among families in the United States with a correlation coefficient (R) of 0.585 and weighted average of 10.8%. Similarly, the statistical analysis conducted on geographies consisting of 195,180,585 people shows no correlation between the proportion of Immigrants from Czechoslovakia and poverty level among families in the United States with a correlation coefficient (R) of -0.012 and weighted average of 7.7%, a difference of 41.0%.
Family Poverty Correlation Summary
| Measurement | Immigrants from Liberia | Immigrants from Czechoslovakia |
| Minimum | 3.1% | 0.73% |
| Maximum | 40.1% | 19.0% |
| Range | 37.0% | 18.3% |
| Mean | 11.9% | 7.4% |
| Median | 9.6% | 6.7% |
| Interquartile 25% (IQ1) | 7.8% | 5.2% |
| Interquartile 75% (IQ3) | 13.8% | 8.3% |
| Interquartile Range (IQR) | 6.0% | 3.1% |
| Standard Deviation (Sample) | 6.8% | 3.7% |
| Standard Deviation (Population) | 6.7% | 3.7% |
Similar Demographics by Family Poverty
Demographics Similar to Immigrants from Liberia by Family Poverty
In terms of family poverty, the demographic groups most similar to Immigrants from Liberia are Chickasaw (10.8%, a difference of 0.26%), Immigrants from Ghana (10.8%, a difference of 0.30%), Subsaharan African (10.9%, a difference of 0.34%), Ecuadorian (10.8%, a difference of 0.37%), and Mexican American Indian (10.9%, a difference of 0.38%).
| Demographics | Rating | Rank | Family Poverty |
| Nicaraguans | 0.4 /100 | #248 | Tragic 10.6% |
| Cubans | 0.4 /100 | #249 | Tragic 10.6% |
| Salvadorans | 0.3 /100 | #250 | Tragic 10.7% |
| Iroquois | 0.3 /100 | #251 | Tragic 10.7% |
| Immigrants | Zaire | 0.3 /100 | #252 | Tragic 10.7% |
| Immigrants | Western Africa | 0.3 /100 | #253 | Tragic 10.7% |
| Ecuadorians | 0.2 /100 | #254 | Tragic 10.8% |
| Immigrants | Liberia | 0.2 /100 | #255 | Tragic 10.8% |
| Chickasaw | 0.2 /100 | #256 | Tragic 10.8% |
| Immigrants | Ghana | 0.2 /100 | #257 | Tragic 10.8% |
| Sub-Saharan Africans | 0.2 /100 | #258 | Tragic 10.9% |
| Mexican American Indians | 0.2 /100 | #259 | Tragic 10.9% |
| Bangladeshis | 0.2 /100 | #260 | Tragic 10.9% |
| Shoshone | 0.2 /100 | #261 | Tragic 10.9% |
| Spanish American Indians | 0.2 /100 | #262 | Tragic 10.9% |
Demographics Similar to Immigrants from Czechoslovakia by Family Poverty
In terms of family poverty, the demographic groups most similar to Immigrants from Czechoslovakia are Tongan (7.7%, a difference of 0.010%), Immigrants from Sri Lanka (7.7%, a difference of 0.020%), Okinawan (7.7%, a difference of 0.030%), German (7.7%, a difference of 0.15%), and Immigrants from Bolivia (7.7%, a difference of 0.20%).
| Demographics | Rating | Rank | Family Poverty |
| Slovenes | 99.3 /100 | #40 | Exceptional 7.5% |
| Immigrants | Australia | 99.2 /100 | #41 | Exceptional 7.6% |
| Scandinavians | 99.1 /100 | #42 | Exceptional 7.6% |
| Immigrants | Austria | 99.1 /100 | #43 | Exceptional 7.6% |
| Germans | 99.0 /100 | #44 | Exceptional 7.7% |
| Okinawans | 98.9 /100 | #45 | Exceptional 7.7% |
| Tongans | 98.9 /100 | #46 | Exceptional 7.7% |
| Immigrants | Czechoslovakia | 98.9 /100 | #47 | Exceptional 7.7% |
| Immigrants | Sri Lanka | 98.9 /100 | #48 | Exceptional 7.7% |
| Immigrants | Bolivia | 98.9 /100 | #49 | Exceptional 7.7% |
| Immigrants | North Macedonia | 98.9 /100 | #50 | Exceptional 7.7% |
| Immigrants | Moldova | 98.8 /100 | #51 | Exceptional 7.7% |
| Indians (Asian) | 98.8 /100 | #52 | Exceptional 7.7% |
| Swiss | 98.8 /100 | #53 | Exceptional 7.7% |
| Immigrants | Sweden | 98.8 /100 | #54 | Exceptional 7.7% |