Bahamian vs Austrian Doctorate Degree
COMPARE
Bahamian
Austrian
Doctorate Degree
Doctorate Degree Comparison
Bahamians
Austrians
1.5%
DOCTORATE DEGREE
0.4/ 100
METRIC RATING
277th/ 347
METRIC RANK
2.1%
DOCTORATE DEGREE
98.0/ 100
METRIC RATING
104th/ 347
METRIC RANK
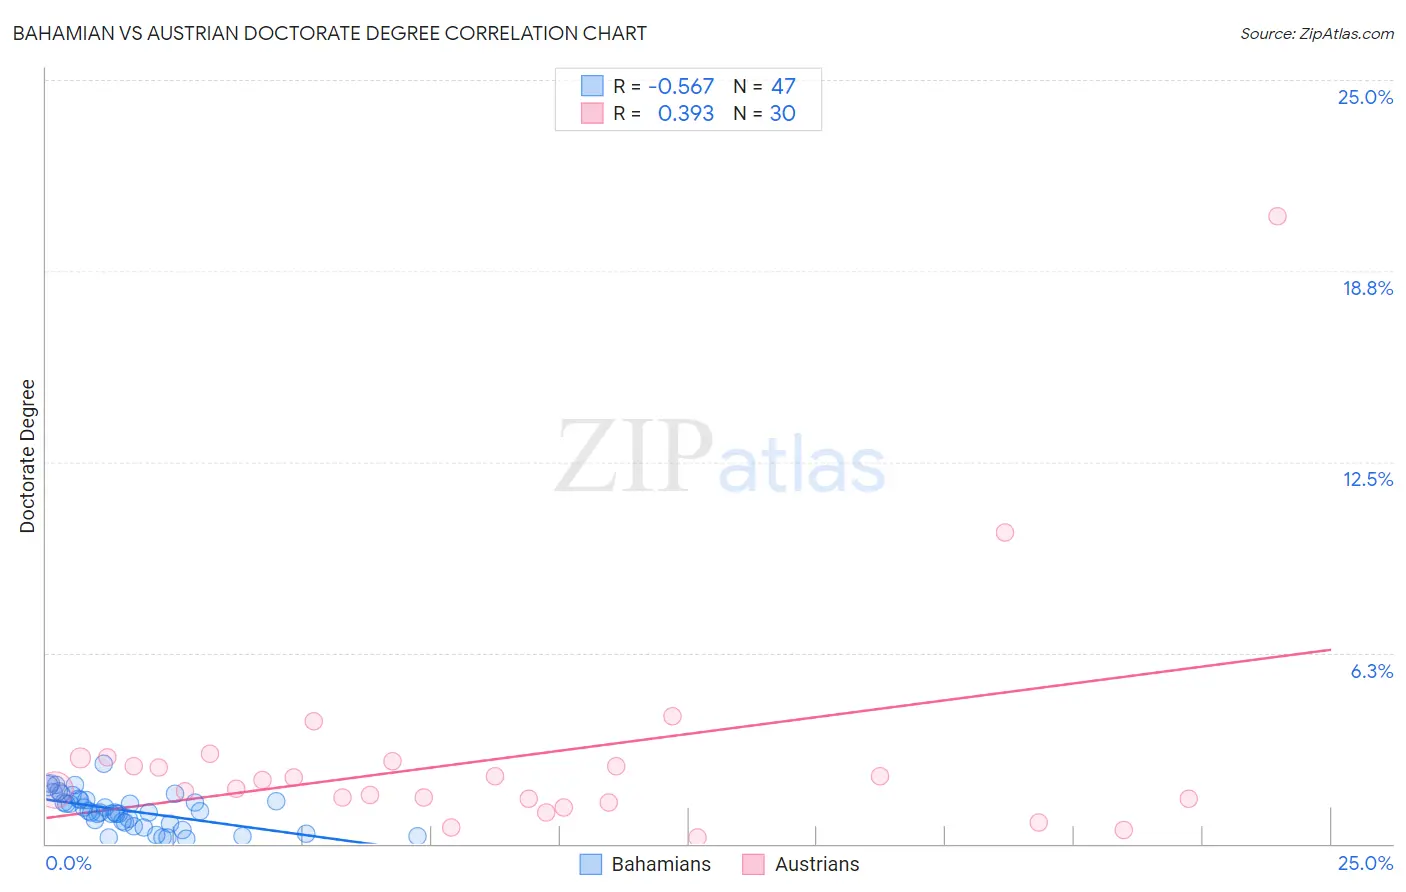
Bahamian vs Austrian Doctorate Degree Correlation Chart
The statistical analysis conducted on geographies consisting of 112,287,589 people shows a substantial negative correlation between the proportion of Bahamians and percentage of population with at least doctorate degree education in the United States with a correlation coefficient (R) of -0.567 and weighted average of 1.5%. Similarly, the statistical analysis conducted on geographies consisting of 445,801,331 people shows a mild positive correlation between the proportion of Austrians and percentage of population with at least doctorate degree education in the United States with a correlation coefficient (R) of 0.393 and weighted average of 2.1%, a difference of 43.6%.
Doctorate Degree Correlation Summary
| Measurement | Bahamian | Austrian |
| Minimum | 0.18% | 0.20% |
| Maximum | 2.6% | 20.5% |
| Range | 2.5% | 20.3% |
| Mean | 1.1% | 2.8% |
| Median | 1.0% | 1.9% |
| Interquartile 25% (IQ1) | 0.64% | 1.5% |
| Interquartile 75% (IQ3) | 1.4% | 2.7% |
| Interquartile Range (IQR) | 0.80% | 1.2% |
| Standard Deviation (Sample) | 0.57% | 3.8% |
| Standard Deviation (Population) | 0.57% | 3.7% |
Similar Demographics by Doctorate Degree
Demographics Similar to Bahamians by Doctorate Degree
In terms of doctorate degree, the demographic groups most similar to Bahamians are Hawaiian (1.5%, a difference of 0.060%), Marshallese (1.5%, a difference of 0.28%), Ecuadorian (1.5%, a difference of 0.29%), Tohono O'odham (1.5%, a difference of 0.35%), and British West Indian (1.5%, a difference of 0.41%).
| Demographics | Rating | Rank | Doctorate Degree |
| Salvadorans | 0.5 /100 | #270 | Tragic 1.5% |
| Immigrants | Trinidad and Tobago | 0.5 /100 | #271 | Tragic 1.5% |
| Immigrants | Barbados | 0.4 /100 | #272 | Tragic 1.5% |
| Sioux | 0.4 /100 | #273 | Tragic 1.5% |
| Yaqui | 0.4 /100 | #274 | Tragic 1.5% |
| Aleuts | 0.4 /100 | #275 | Tragic 1.5% |
| Paiute | 0.4 /100 | #276 | Tragic 1.5% |
| Bahamians | 0.4 /100 | #277 | Tragic 1.5% |
| Hawaiians | 0.4 /100 | #278 | Tragic 1.5% |
| Marshallese | 0.4 /100 | #279 | Tragic 1.5% |
| Ecuadorians | 0.4 /100 | #280 | Tragic 1.5% |
| Tohono O'odham | 0.4 /100 | #281 | Tragic 1.5% |
| British West Indians | 0.3 /100 | #282 | Tragic 1.5% |
| Central Americans | 0.3 /100 | #283 | Tragic 1.5% |
| Jamaicans | 0.3 /100 | #284 | Tragic 1.5% |
Demographics Similar to Austrians by Doctorate Degree
In terms of doctorate degree, the demographic groups most similar to Austrians are Romanian (2.1%, a difference of 0.12%), Immigrants from Chile (2.1%, a difference of 0.13%), Immigrants from Eastern Africa (2.1%, a difference of 0.35%), Arab (2.1%, a difference of 0.35%), and Immigrants from Egypt (2.1%, a difference of 0.38%).
| Demographics | Rating | Rank | Doctorate Degree |
| Immigrants | Eritrea | 98.4 /100 | #97 | Exceptional 2.1% |
| Armenians | 98.3 /100 | #98 | Exceptional 2.1% |
| Immigrants | Egypt | 98.2 /100 | #99 | Exceptional 2.1% |
| Immigrants | Eastern Europe | 98.2 /100 | #100 | Exceptional 2.1% |
| Immigrants | Eastern Africa | 98.2 /100 | #101 | Exceptional 2.1% |
| Immigrants | Chile | 98.1 /100 | #102 | Exceptional 2.1% |
| Romanians | 98.1 /100 | #103 | Exceptional 2.1% |
| Austrians | 98.0 /100 | #104 | Exceptional 2.1% |
| Arabs | 97.8 /100 | #105 | Exceptional 2.1% |
| Sudanese | 97.7 /100 | #106 | Exceptional 2.1% |
| Europeans | 97.5 /100 | #107 | Exceptional 2.1% |
| Immigrants | Germany | 97.3 /100 | #108 | Exceptional 2.1% |
| Ukrainians | 97.2 /100 | #109 | Exceptional 2.1% |
| Brazilians | 97.2 /100 | #110 | Exceptional 2.1% |
| Immigrants | Pakistan | 97.1 /100 | #111 | Exceptional 2.1% |