Soviet Union vs Immigrants from Peru Seniors Poverty Over the Age of 65
COMPARE
Soviet Union
Immigrants from Peru
Seniors Poverty Over the Age of 65
Seniors Poverty Over the Age of 65 Comparison
Soviet Union
Immigrants from Peru
12.6%
SENIORS POVERTY OVER THE AGE OF 65
0.1/ 100
METRIC RATING
263rd/ 347
METRIC RANK
12.0%
SENIORS POVERTY OVER THE AGE OF 65
1.3/ 100
METRIC RATING
236th/ 347
METRIC RANK
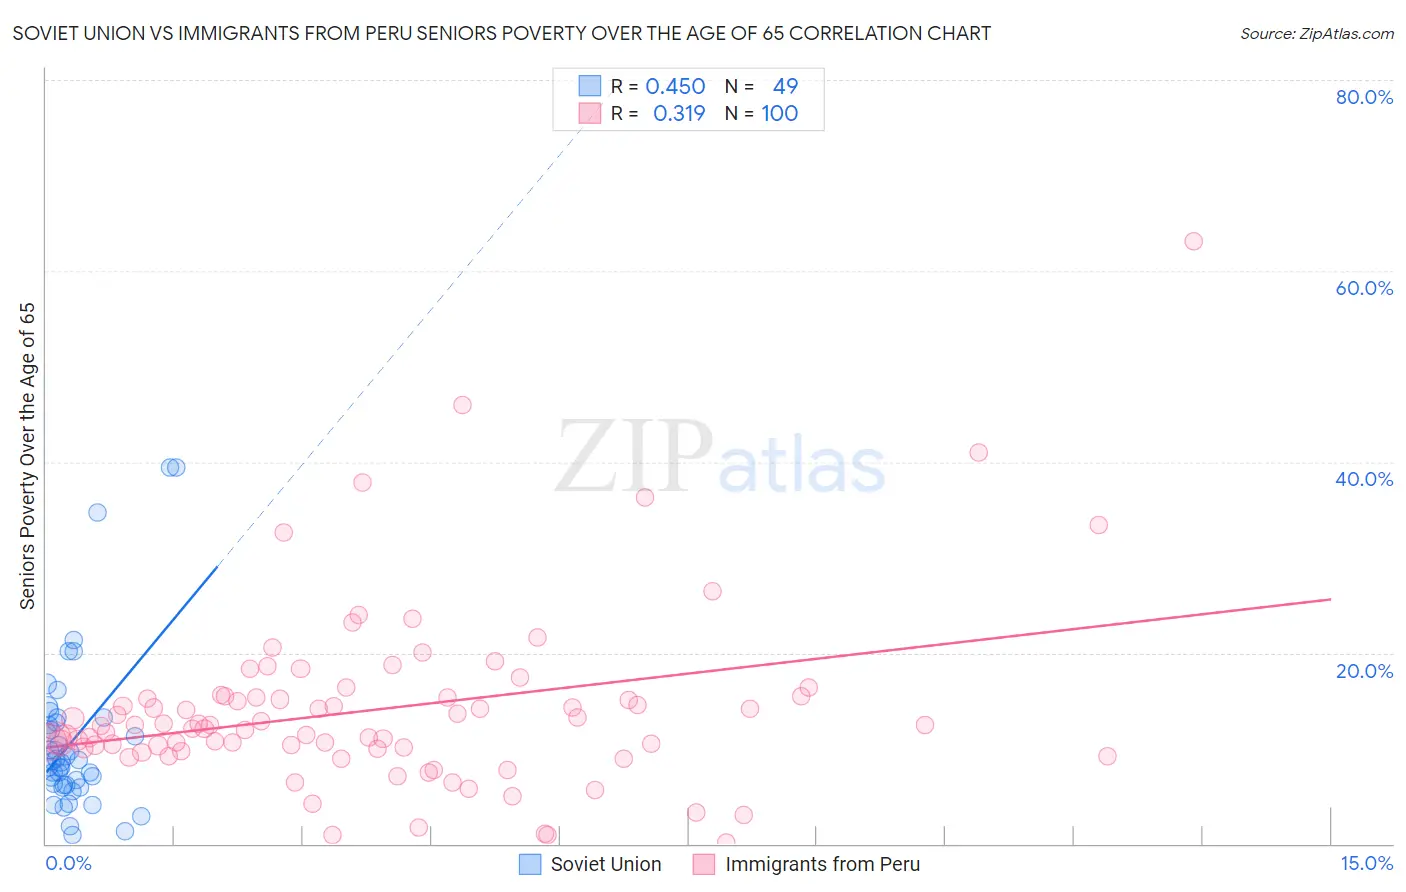
Soviet Union vs Immigrants from Peru Seniors Poverty Over the Age of 65 Correlation Chart
The statistical analysis conducted on geographies consisting of 43,451,489 people shows a moderate positive correlation between the proportion of Soviet Union and poverty level among seniors over the age of 65 in the United States with a correlation coefficient (R) of 0.450 and weighted average of 12.6%. Similarly, the statistical analysis conducted on geographies consisting of 328,128,763 people shows a mild positive correlation between the proportion of Immigrants from Peru and poverty level among seniors over the age of 65 in the United States with a correlation coefficient (R) of 0.319 and weighted average of 12.0%, a difference of 4.8%.
Seniors Poverty Over the Age of 65 Correlation Summary
| Measurement | Soviet Union | Immigrants from Peru |
| Minimum | 0.90% | 0.12% |
| Maximum | 39.4% | 63.2% |
| Range | 38.5% | 63.0% |
| Mean | 10.9% | 14.1% |
| Median | 8.7% | 12.4% |
| Interquartile 25% (IQ1) | 6.1% | 10.0% |
| Interquartile 75% (IQ3) | 12.9% | 15.4% |
| Interquartile Range (IQR) | 6.8% | 5.4% |
| Standard Deviation (Sample) | 8.4% | 9.4% |
| Standard Deviation (Population) | 8.3% | 9.4% |
Similar Demographics by Seniors Poverty Over the Age of 65
Demographics Similar to Soviet Union by Seniors Poverty Over the Age of 65
In terms of seniors poverty over the age of 65, the demographic groups most similar to Soviet Union are Inupiat (12.6%, a difference of 0.070%), Immigrants from Western Africa (12.6%, a difference of 0.16%), Venezuelan (12.5%, a difference of 0.17%), African (12.6%, a difference of 0.33%), and Colombian (12.5%, a difference of 0.37%).
| Demographics | Rating | Rank | Seniors Poverty Over the Age of 65 |
| Immigrants | Panama | 0.2 /100 | #256 | Tragic 12.4% |
| Immigrants | Immigrants | 0.2 /100 | #257 | Tragic 12.4% |
| Dutch West Indians | 0.2 /100 | #258 | Tragic 12.4% |
| Ghanaians | 0.2 /100 | #259 | Tragic 12.4% |
| South Americans | 0.2 /100 | #260 | Tragic 12.5% |
| Colombians | 0.2 /100 | #261 | Tragic 12.5% |
| Venezuelans | 0.1 /100 | #262 | Tragic 12.5% |
| Soviet Union | 0.1 /100 | #263 | Tragic 12.6% |
| Inupiat | 0.1 /100 | #264 | Tragic 12.6% |
| Immigrants | Western Africa | 0.1 /100 | #265 | Tragic 12.6% |
| Africans | 0.1 /100 | #266 | Tragic 12.6% |
| Blackfeet | 0.1 /100 | #267 | Tragic 12.6% |
| Immigrants | Somalia | 0.1 /100 | #268 | Tragic 12.6% |
| Immigrants | Venezuela | 0.1 /100 | #269 | Tragic 12.7% |
| Immigrants | South America | 0.1 /100 | #270 | Tragic 12.7% |
Demographics Similar to Immigrants from Peru by Seniors Poverty Over the Age of 65
In terms of seniors poverty over the age of 65, the demographic groups most similar to Immigrants from Peru are Immigrants from Argentina (12.0%, a difference of 0.030%), Moroccan (12.0%, a difference of 0.15%), Seminole (12.0%, a difference of 0.37%), Iroquois (11.9%, a difference of 0.53%), and Panamanian (11.9%, a difference of 0.63%).
| Demographics | Rating | Rank | Seniors Poverty Over the Age of 65 |
| Immigrants | Eritrea | 2.6 /100 | #229 | Tragic 11.8% |
| Bermudans | 2.1 /100 | #230 | Tragic 11.9% |
| Cajuns | 2.0 /100 | #231 | Tragic 11.9% |
| Yaqui | 1.9 /100 | #232 | Tragic 11.9% |
| Panamanians | 1.8 /100 | #233 | Tragic 11.9% |
| Iroquois | 1.7 /100 | #234 | Tragic 11.9% |
| Immigrants | Argentina | 1.3 /100 | #235 | Tragic 12.0% |
| Immigrants | Peru | 1.3 /100 | #236 | Tragic 12.0% |
| Moroccans | 1.2 /100 | #237 | Tragic 12.0% |
| Seminole | 1.1 /100 | #238 | Tragic 12.0% |
| Immigrants | Spain | 1.0 /100 | #239 | Tragic 12.1% |
| Comanche | 0.9 /100 | #240 | Tragic 12.1% |
| Immigrants | Albania | 0.9 /100 | #241 | Tragic 12.1% |
| Sub-Saharan Africans | 0.9 /100 | #242 | Tragic 12.1% |
| Uruguayans | 0.8 /100 | #243 | Tragic 12.1% |