Sudanese vs Immigrants from Peru Seniors Poverty Over the Age of 65
COMPARE
Sudanese
Immigrants from Peru
Seniors Poverty Over the Age of 65
Seniors Poverty Over the Age of 65 Comparison
Sudanese
Immigrants from Peru
10.7%
SENIORS POVERTY OVER THE AGE OF 65
68.2/ 100
METRIC RATING
160th/ 347
METRIC RANK
12.0%
SENIORS POVERTY OVER THE AGE OF 65
1.3/ 100
METRIC RATING
236th/ 347
METRIC RANK
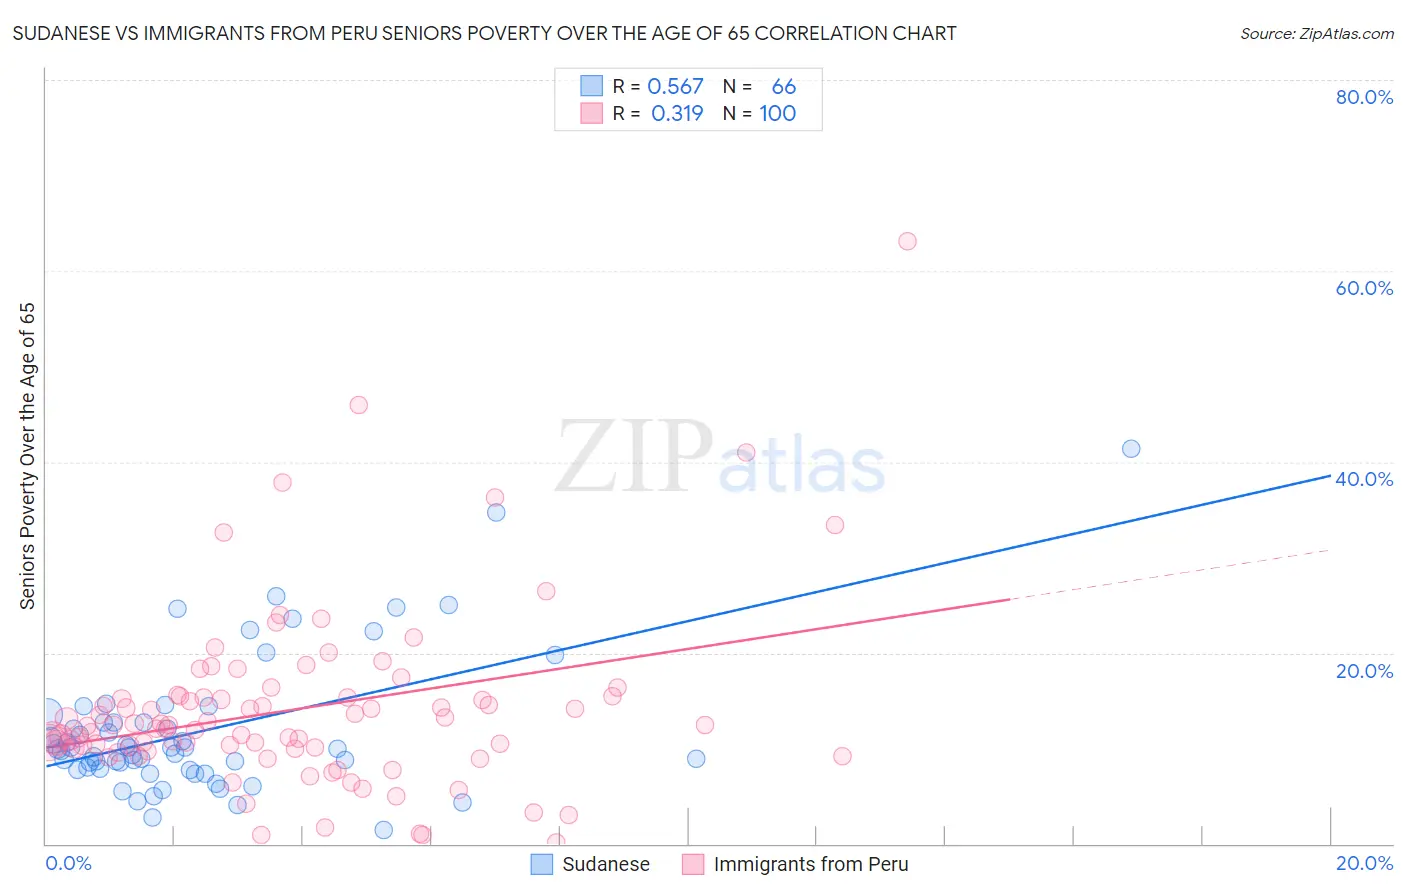
Sudanese vs Immigrants from Peru Seniors Poverty Over the Age of 65 Correlation Chart
The statistical analysis conducted on geographies consisting of 109,984,274 people shows a substantial positive correlation between the proportion of Sudanese and poverty level among seniors over the age of 65 in the United States with a correlation coefficient (R) of 0.567 and weighted average of 10.7%. Similarly, the statistical analysis conducted on geographies consisting of 328,128,763 people shows a mild positive correlation between the proportion of Immigrants from Peru and poverty level among seniors over the age of 65 in the United States with a correlation coefficient (R) of 0.319 and weighted average of 12.0%, a difference of 11.5%.
Seniors Poverty Over the Age of 65 Correlation Summary
| Measurement | Sudanese | Immigrants from Peru |
| Minimum | 1.4% | 0.12% |
| Maximum | 41.4% | 63.2% |
| Range | 40.0% | 63.0% |
| Mean | 11.9% | 14.1% |
| Median | 9.9% | 12.4% |
| Interquartile 25% (IQ1) | 7.8% | 10.0% |
| Interquartile 75% (IQ3) | 12.7% | 15.4% |
| Interquartile Range (IQR) | 4.9% | 5.4% |
| Standard Deviation (Sample) | 7.3% | 9.4% |
| Standard Deviation (Population) | 7.3% | 9.4% |
Similar Demographics by Seniors Poverty Over the Age of 65
Demographics Similar to Sudanese by Seniors Poverty Over the Age of 65
In terms of seniors poverty over the age of 65, the demographic groups most similar to Sudanese are Immigrants from Micronesia (10.7%, a difference of 0.27%), Arab (10.8%, a difference of 0.31%), Immigrants from Indonesia (10.8%, a difference of 0.35%), Immigrants from Sierra Leone (10.7%, a difference of 0.37%), and Tsimshian (10.8%, a difference of 0.38%).
| Demographics | Rating | Rank | Seniors Poverty Over the Age of 65 |
| Fijians | 75.6 /100 | #153 | Good 10.7% |
| Immigrants | Saudi Arabia | 74.9 /100 | #154 | Good 10.7% |
| Chickasaw | 73.6 /100 | #155 | Good 10.7% |
| Ethiopians | 72.9 /100 | #156 | Good 10.7% |
| Immigrants | Ethiopia | 72.9 /100 | #157 | Good 10.7% |
| Immigrants | Sierra Leone | 71.7 /100 | #158 | Good 10.7% |
| Immigrants | Micronesia | 70.8 /100 | #159 | Good 10.7% |
| Sudanese | 68.2 /100 | #160 | Good 10.7% |
| Arabs | 65.2 /100 | #161 | Good 10.8% |
| Immigrants | Indonesia | 64.8 /100 | #162 | Good 10.8% |
| Tsimshian | 64.5 /100 | #163 | Good 10.8% |
| Potawatomi | 62.6 /100 | #164 | Good 10.8% |
| Immigrants | South Eastern Asia | 62.1 /100 | #165 | Good 10.8% |
| Malaysians | 62.0 /100 | #166 | Good 10.8% |
| Alaska Natives | 60.3 /100 | #167 | Good 10.8% |
Demographics Similar to Immigrants from Peru by Seniors Poverty Over the Age of 65
In terms of seniors poverty over the age of 65, the demographic groups most similar to Immigrants from Peru are Immigrants from Argentina (12.0%, a difference of 0.030%), Moroccan (12.0%, a difference of 0.15%), Seminole (12.0%, a difference of 0.37%), Iroquois (11.9%, a difference of 0.53%), and Panamanian (11.9%, a difference of 0.63%).
| Demographics | Rating | Rank | Seniors Poverty Over the Age of 65 |
| Immigrants | Eritrea | 2.6 /100 | #229 | Tragic 11.8% |
| Bermudans | 2.1 /100 | #230 | Tragic 11.9% |
| Cajuns | 2.0 /100 | #231 | Tragic 11.9% |
| Yaqui | 1.9 /100 | #232 | Tragic 11.9% |
| Panamanians | 1.8 /100 | #233 | Tragic 11.9% |
| Iroquois | 1.7 /100 | #234 | Tragic 11.9% |
| Immigrants | Argentina | 1.3 /100 | #235 | Tragic 12.0% |
| Immigrants | Peru | 1.3 /100 | #236 | Tragic 12.0% |
| Moroccans | 1.2 /100 | #237 | Tragic 12.0% |
| Seminole | 1.1 /100 | #238 | Tragic 12.0% |
| Immigrants | Spain | 1.0 /100 | #239 | Tragic 12.1% |
| Comanche | 0.9 /100 | #240 | Tragic 12.1% |
| Immigrants | Albania | 0.9 /100 | #241 | Tragic 12.1% |
| Sub-Saharan Africans | 0.9 /100 | #242 | Tragic 12.1% |
| Uruguayans | 0.8 /100 | #243 | Tragic 12.1% |