Indian (Asian) vs Immigrants from Peru Seniors Poverty Over the Age of 65
COMPARE
Indian (Asian)
Immigrants from Peru
Seniors Poverty Over the Age of 65
Seniors Poverty Over the Age of 65 Comparison
Indians (Asian)
Immigrants from Peru
11.1%
SENIORS POVERTY OVER THE AGE OF 65
34.2/ 100
METRIC RATING
190th/ 347
METRIC RANK
12.0%
SENIORS POVERTY OVER THE AGE OF 65
1.3/ 100
METRIC RATING
236th/ 347
METRIC RANK
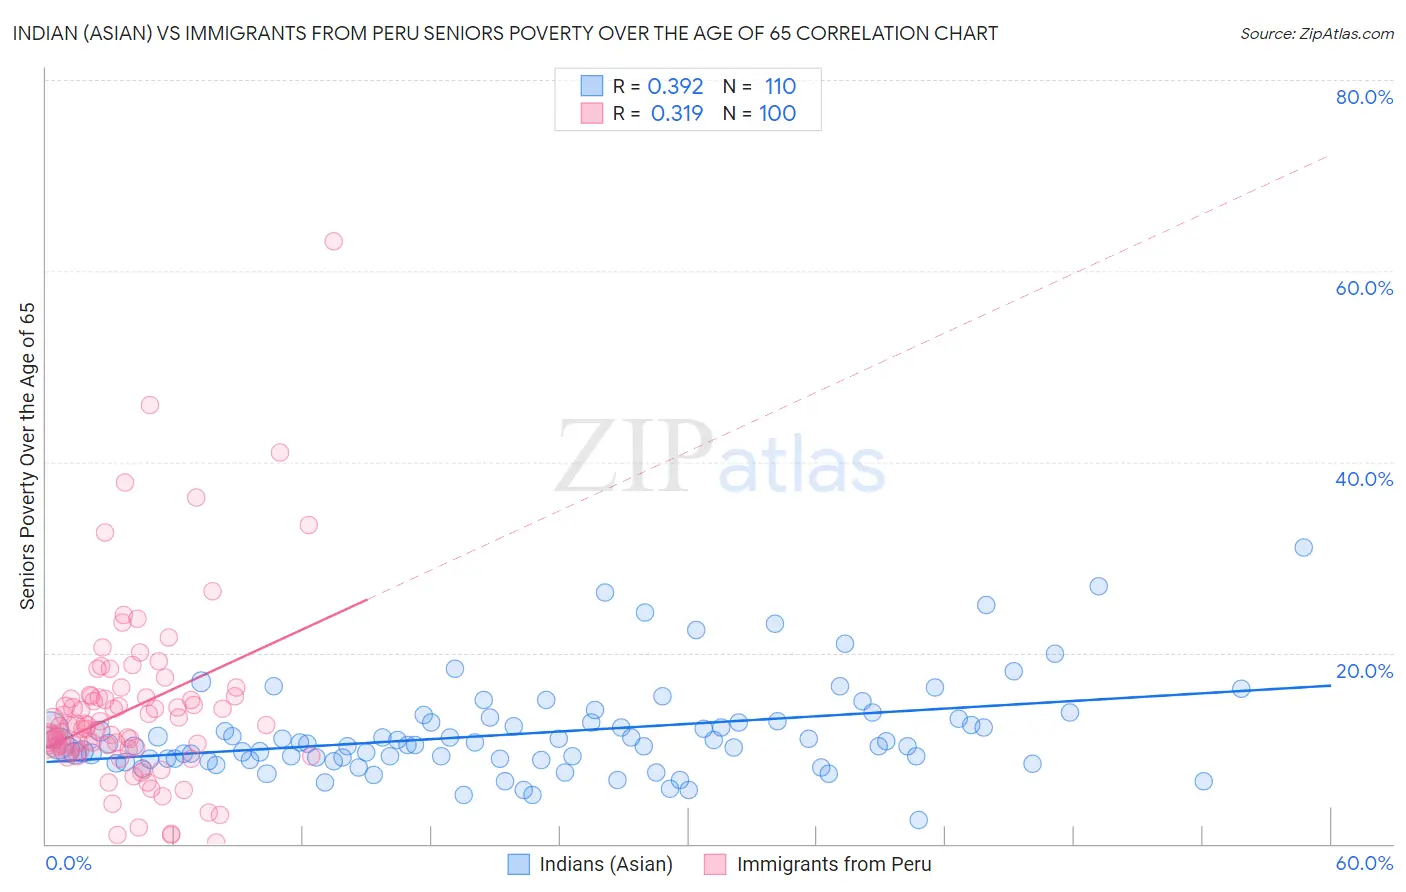
Indian (Asian) vs Immigrants from Peru Seniors Poverty Over the Age of 65 Correlation Chart
The statistical analysis conducted on geographies consisting of 492,457,214 people shows a mild positive correlation between the proportion of Indians (Asian) and poverty level among seniors over the age of 65 in the United States with a correlation coefficient (R) of 0.392 and weighted average of 11.1%. Similarly, the statistical analysis conducted on geographies consisting of 328,128,763 people shows a mild positive correlation between the proportion of Immigrants from Peru and poverty level among seniors over the age of 65 in the United States with a correlation coefficient (R) of 0.319 and weighted average of 12.0%, a difference of 8.0%.
Seniors Poverty Over the Age of 65 Correlation Summary
| Measurement | Indian (Asian) | Immigrants from Peru |
| Minimum | 2.4% | 0.12% |
| Maximum | 31.1% | 63.2% |
| Range | 28.6% | 63.0% |
| Mean | 11.6% | 14.1% |
| Median | 10.4% | 12.4% |
| Interquartile 25% (IQ1) | 8.9% | 10.0% |
| Interquartile 75% (IQ3) | 12.7% | 15.4% |
| Interquartile Range (IQR) | 3.8% | 5.4% |
| Standard Deviation (Sample) | 4.9% | 9.4% |
| Standard Deviation (Population) | 4.9% | 9.4% |
Similar Demographics by Seniors Poverty Over the Age of 65
Demographics Similar to Indians (Asian) by Seniors Poverty Over the Age of 65
In terms of seniors poverty over the age of 65, the demographic groups most similar to Indians (Asian) are Immigrants from Laos (11.1%, a difference of 0.15%), Immigrants from Uganda (11.1%, a difference of 0.20%), Immigrants from Hong Kong (11.1%, a difference of 0.21%), Immigrants from Middle Africa (11.1%, a difference of 0.31%), and Immigrants from Eastern Asia (11.1%, a difference of 0.32%).
| Demographics | Rating | Rank | Seniors Poverty Over the Age of 65 |
| Immigrants | Kazakhstan | 41.0 /100 | #183 | Average 11.0% |
| Immigrants | France | 40.9 /100 | #184 | Average 11.0% |
| Immigrants | Lebanon | 38.2 /100 | #185 | Fair 11.1% |
| Immigrants | Eastern Asia | 37.5 /100 | #186 | Fair 11.1% |
| Immigrants | Middle Africa | 37.4 /100 | #187 | Fair 11.1% |
| Immigrants | Hong Kong | 36.3 /100 | #188 | Fair 11.1% |
| Immigrants | Laos | 35.7 /100 | #189 | Fair 11.1% |
| Indians (Asian) | 34.2 /100 | #190 | Fair 11.1% |
| Immigrants | Uganda | 32.2 /100 | #191 | Fair 11.1% |
| Immigrants | Southern Europe | 30.1 /100 | #192 | Fair 11.1% |
| Taiwanese | 29.2 /100 | #193 | Fair 11.2% |
| Chileans | 27.8 /100 | #194 | Fair 11.2% |
| Immigrants | Vietnam | 26.6 /100 | #195 | Fair 11.2% |
| Bangladeshis | 25.2 /100 | #196 | Fair 11.2% |
| Albanians | 24.4 /100 | #197 | Fair 11.2% |
Demographics Similar to Immigrants from Peru by Seniors Poverty Over the Age of 65
In terms of seniors poverty over the age of 65, the demographic groups most similar to Immigrants from Peru are Immigrants from Argentina (12.0%, a difference of 0.030%), Moroccan (12.0%, a difference of 0.15%), Seminole (12.0%, a difference of 0.37%), Iroquois (11.9%, a difference of 0.53%), and Panamanian (11.9%, a difference of 0.63%).
| Demographics | Rating | Rank | Seniors Poverty Over the Age of 65 |
| Immigrants | Eritrea | 2.6 /100 | #229 | Tragic 11.8% |
| Bermudans | 2.1 /100 | #230 | Tragic 11.9% |
| Cajuns | 2.0 /100 | #231 | Tragic 11.9% |
| Yaqui | 1.9 /100 | #232 | Tragic 11.9% |
| Panamanians | 1.8 /100 | #233 | Tragic 11.9% |
| Iroquois | 1.7 /100 | #234 | Tragic 11.9% |
| Immigrants | Argentina | 1.3 /100 | #235 | Tragic 12.0% |
| Immigrants | Peru | 1.3 /100 | #236 | Tragic 12.0% |
| Moroccans | 1.2 /100 | #237 | Tragic 12.0% |
| Seminole | 1.1 /100 | #238 | Tragic 12.0% |
| Immigrants | Spain | 1.0 /100 | #239 | Tragic 12.1% |
| Comanche | 0.9 /100 | #240 | Tragic 12.1% |
| Immigrants | Albania | 0.9 /100 | #241 | Tragic 12.1% |
| Sub-Saharan Africans | 0.9 /100 | #242 | Tragic 12.1% |
| Uruguayans | 0.8 /100 | #243 | Tragic 12.1% |