Austrian vs Spaniard Seniors Poverty Over the Age of 65
COMPARE
Austrian
Spaniard
Seniors Poverty Over the Age of 65
Seniors Poverty Over the Age of 65 Comparison
Austrians
Spaniards
9.6%
SENIORS POVERTY OVER THE AGE OF 65
99.5/ 100
METRIC RATING
44th/ 347
METRIC RANK
10.9%
SENIORS POVERTY OVER THE AGE OF 65
50.7/ 100
METRIC RATING
173rd/ 347
METRIC RANK
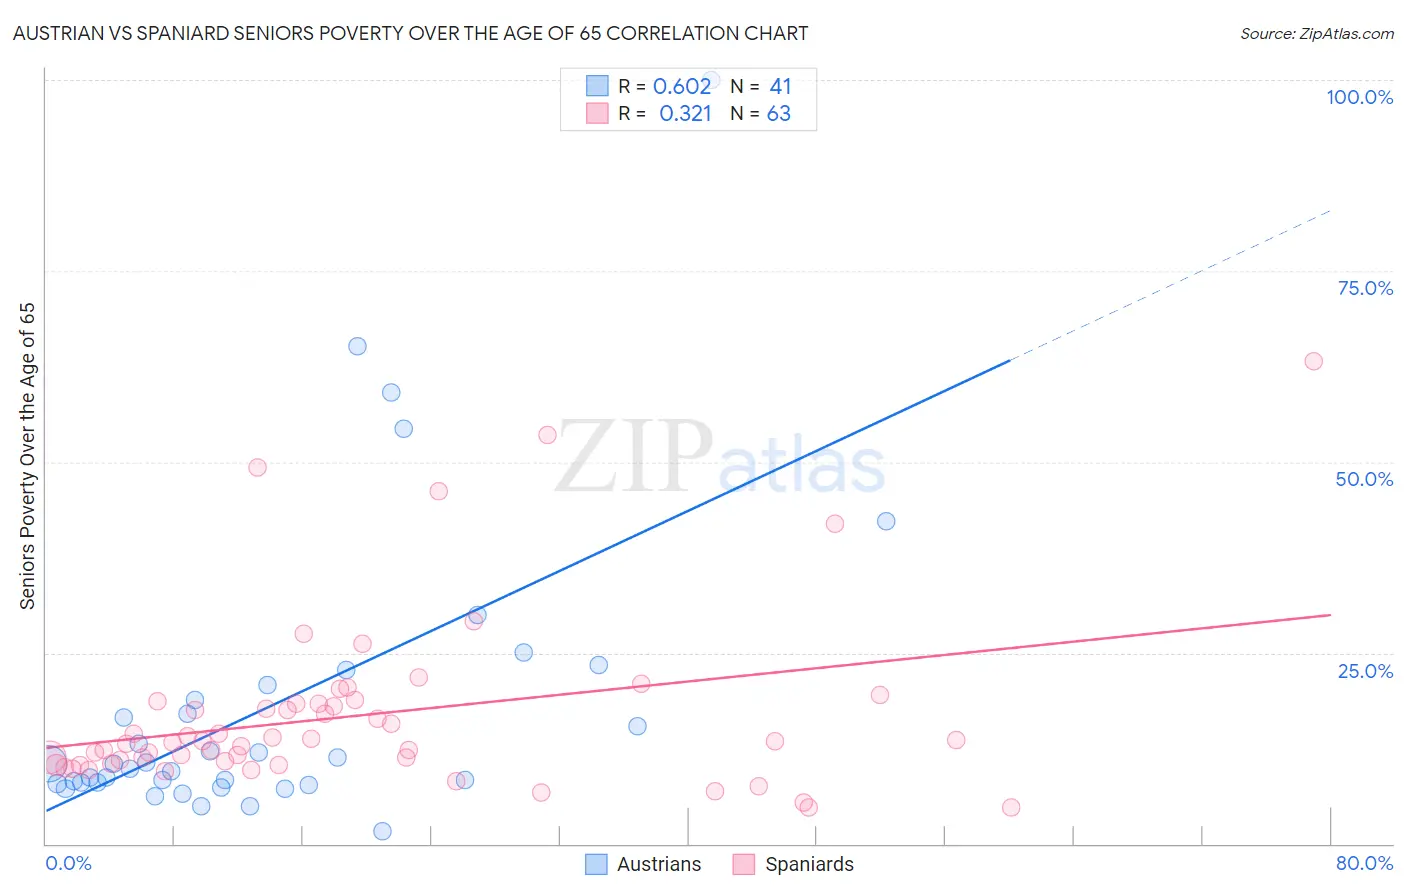
Austrian vs Spaniard Seniors Poverty Over the Age of 65 Correlation Chart
The statistical analysis conducted on geographies consisting of 450,094,834 people shows a significant positive correlation between the proportion of Austrians and poverty level among seniors over the age of 65 in the United States with a correlation coefficient (R) of 0.602 and weighted average of 9.6%. Similarly, the statistical analysis conducted on geographies consisting of 441,385,705 people shows a mild positive correlation between the proportion of Spaniards and poverty level among seniors over the age of 65 in the United States with a correlation coefficient (R) of 0.321 and weighted average of 10.9%, a difference of 13.5%.
Seniors Poverty Over the Age of 65 Correlation Summary
| Measurement | Austrian | Spaniard |
| Minimum | 1.6% | 4.7% |
| Maximum | 100.0% | 63.2% |
| Range | 98.4% | 58.4% |
| Mean | 18.0% | 16.8% |
| Median | 10.5% | 13.4% |
| Interquartile 25% (IQ1) | 7.9% | 10.5% |
| Interquartile 75% (IQ3) | 19.8% | 18.4% |
| Interquartile Range (IQR) | 11.8% | 7.8% |
| Standard Deviation (Sample) | 19.7% | 11.4% |
| Standard Deviation (Population) | 19.4% | 11.4% |
Similar Demographics by Seniors Poverty Over the Age of 65
Demographics Similar to Austrians by Seniors Poverty Over the Age of 65
In terms of seniors poverty over the age of 65, the demographic groups most similar to Austrians are Eastern European (9.6%, a difference of 0.10%), Estonian (9.6%, a difference of 0.18%), Zimbabwean (9.6%, a difference of 0.20%), Immigrants from Taiwan (9.7%, a difference of 0.32%), and Immigrants from South Central Asia (9.7%, a difference of 0.33%).
| Demographics | Rating | Rank | Seniors Poverty Over the Age of 65 |
| Scotch-Irish | 99.7 /100 | #37 | Exceptional 9.5% |
| Belgians | 99.7 /100 | #38 | Exceptional 9.5% |
| Greeks | 99.6 /100 | #39 | Exceptional 9.6% |
| Assyrians/Chaldeans/Syriacs | 99.6 /100 | #40 | Exceptional 9.6% |
| Immigrants | North Macedonia | 99.6 /100 | #41 | Exceptional 9.6% |
| Zimbabweans | 99.6 /100 | #42 | Exceptional 9.6% |
| Eastern Europeans | 99.6 /100 | #43 | Exceptional 9.6% |
| Austrians | 99.5 /100 | #44 | Exceptional 9.6% |
| Estonians | 99.5 /100 | #45 | Exceptional 9.6% |
| Immigrants | Taiwan | 99.5 /100 | #46 | Exceptional 9.7% |
| Immigrants | South Central Asia | 99.5 /100 | #47 | Exceptional 9.7% |
| French | 99.5 /100 | #48 | Exceptional 9.7% |
| Immigrants | Lithuania | 99.4 /100 | #49 | Exceptional 9.7% |
| Hungarians | 99.4 /100 | #50 | Exceptional 9.7% |
| Carpatho Rusyns | 99.3 /100 | #51 | Exceptional 9.7% |
Demographics Similar to Spaniards by Seniors Poverty Over the Age of 65
In terms of seniors poverty over the age of 65, the demographic groups most similar to Spaniards are Immigrants from Sudan (10.9%, a difference of 0.070%), Creek (10.9%, a difference of 0.10%), Immigrants from Malaysia (11.0%, a difference of 0.25%), Cherokee (11.0%, a difference of 0.30%), and German Russian (11.0%, a difference of 0.34%).
| Demographics | Rating | Rank | Seniors Poverty Over the Age of 65 |
| Malaysians | 62.0 /100 | #166 | Good 10.8% |
| Alaska Natives | 60.3 /100 | #167 | Good 10.8% |
| Mongolians | 58.0 /100 | #168 | Average 10.9% |
| Sri Lankans | 56.8 /100 | #169 | Average 10.9% |
| Immigrants | Eastern Europe | 55.8 /100 | #170 | Average 10.9% |
| Immigrants | Nonimmigrants | 55.1 /100 | #171 | Average 10.9% |
| Immigrants | Syria | 54.7 /100 | #172 | Average 10.9% |
| Spaniards | 50.7 /100 | #173 | Average 10.9% |
| Immigrants | Sudan | 50.0 /100 | #174 | Average 10.9% |
| Creek | 49.6 /100 | #175 | Average 10.9% |
| Immigrants | Malaysia | 47.9 /100 | #176 | Average 11.0% |
| Cherokee | 47.3 /100 | #177 | Average 11.0% |
| German Russians | 46.9 /100 | #178 | Average 11.0% |
| Immigrants | Northern Africa | 44.6 /100 | #179 | Average 11.0% |
| Immigrants | Thailand | 43.5 /100 | #180 | Average 11.0% |