Kiowa vs Estonian Receiving Food Stamps
COMPARE
Kiowa
Estonian
Receiving Food Stamps
Receiving Food Stamps Comparison
Kiowa
Estonians
14.9%
RECEIVING FOOD STAMPS
0.0/ 100
METRIC RATING
279th/ 347
METRIC RANK
9.5%
RECEIVING FOOD STAMPS
99.6/ 100
METRIC RATING
36th/ 347
METRIC RANK
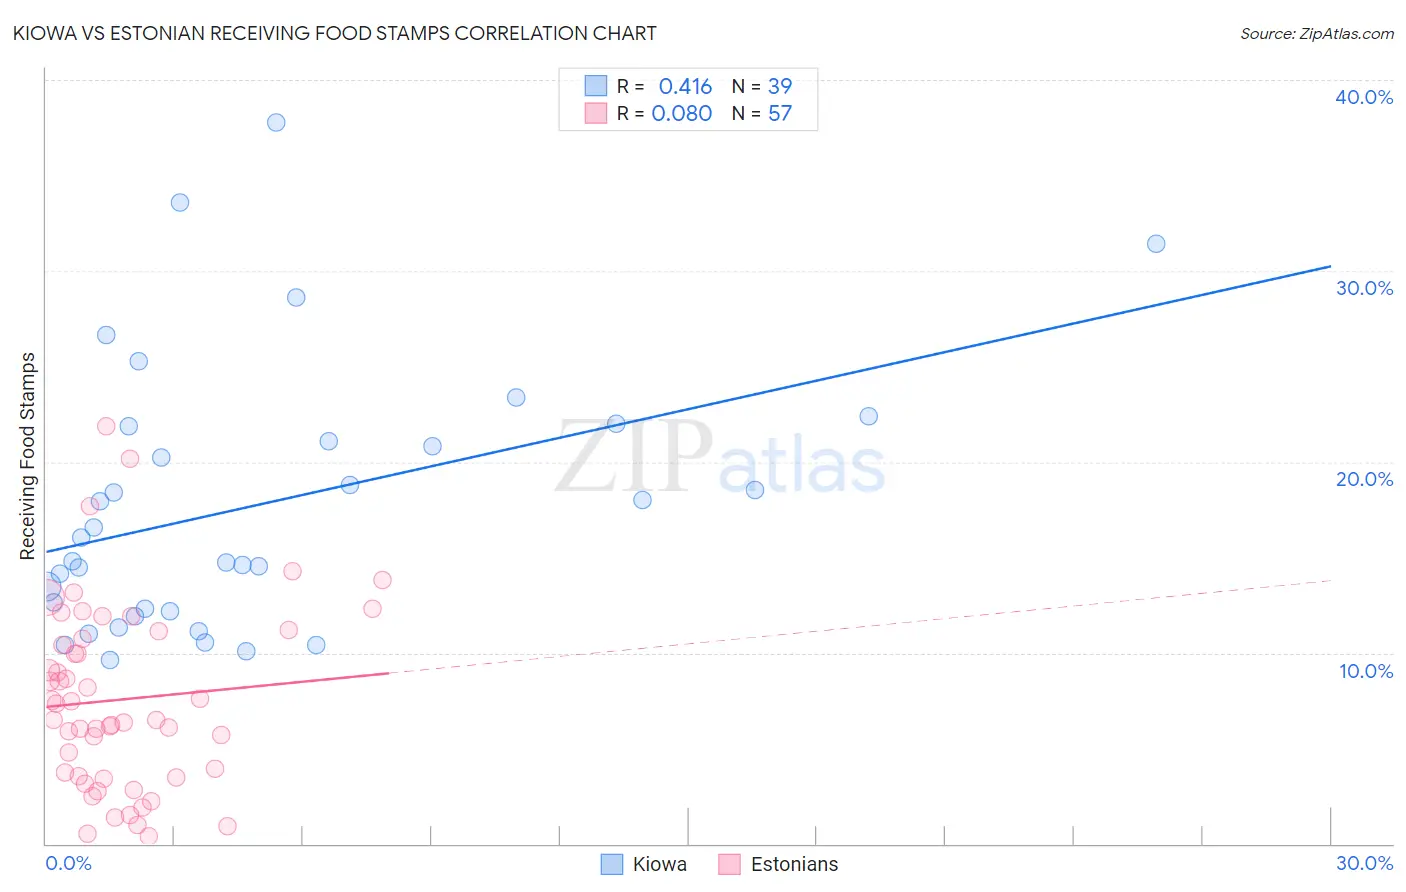
Kiowa vs Estonian Receiving Food Stamps Correlation Chart
The statistical analysis conducted on geographies consisting of 56,088,219 people shows a moderate positive correlation between the proportion of Kiowa and percentage of population receiving government assistance and/or food stamps in the United States with a correlation coefficient (R) of 0.416 and weighted average of 14.9%. Similarly, the statistical analysis conducted on geographies consisting of 123,351,166 people shows a slight positive correlation between the proportion of Estonians and percentage of population receiving government assistance and/or food stamps in the United States with a correlation coefficient (R) of 0.080 and weighted average of 9.5%, a difference of 56.7%.
Receiving Food Stamps Correlation Summary
| Measurement | Kiowa | Estonian |
| Minimum | 9.6% | 0.40% |
| Maximum | 37.8% | 21.8% |
| Range | 28.2% | 21.4% |
| Mean | 17.8% | 7.6% |
| Median | 16.0% | 6.5% |
| Interquartile 25% (IQ1) | 12.2% | 3.5% |
| Interquartile 75% (IQ3) | 21.9% | 10.9% |
| Interquartile Range (IQR) | 9.7% | 7.4% |
| Standard Deviation (Sample) | 6.9% | 4.8% |
| Standard Deviation (Population) | 6.9% | 4.8% |
Similar Demographics by Receiving Food Stamps
Demographics Similar to Kiowa by Receiving Food Stamps
In terms of receiving food stamps, the demographic groups most similar to Kiowa are Ecuadorian (14.9%, a difference of 0.050%), Belizean (14.8%, a difference of 0.27%), Spanish American Indian (14.9%, a difference of 0.37%), Seminole (14.8%, a difference of 0.40%), and Liberian (14.8%, a difference of 0.45%).
| Demographics | Rating | Rank | Receiving Food Stamps |
| Chippewa | 0.1 /100 | #272 | Tragic 14.7% |
| Alaskan Athabascans | 0.1 /100 | #273 | Tragic 14.7% |
| Immigrants | Western Africa | 0.1 /100 | #274 | Tragic 14.7% |
| Ute | 0.1 /100 | #275 | Tragic 14.7% |
| Liberians | 0.1 /100 | #276 | Tragic 14.8% |
| Seminole | 0.1 /100 | #277 | Tragic 14.8% |
| Belizeans | 0.1 /100 | #278 | Tragic 14.8% |
| Kiowa | 0.0 /100 | #279 | Tragic 14.9% |
| Ecuadorians | 0.0 /100 | #280 | Tragic 14.9% |
| Spanish American Indians | 0.0 /100 | #281 | Tragic 14.9% |
| Immigrants | Central America | 0.0 /100 | #282 | Tragic 15.0% |
| Bangladeshis | 0.0 /100 | #283 | Tragic 15.0% |
| Immigrants | Ecuador | 0.0 /100 | #284 | Tragic 15.0% |
| Immigrants | Liberia | 0.0 /100 | #285 | Tragic 15.1% |
| Africans | 0.0 /100 | #286 | Tragic 15.1% |
Demographics Similar to Estonians by Receiving Food Stamps
In terms of receiving food stamps, the demographic groups most similar to Estonians are Immigrants from Austria (9.5%, a difference of 0.020%), Turkish (9.5%, a difference of 0.050%), Zimbabwean (9.5%, a difference of 0.070%), European (9.5%, a difference of 0.070%), and Immigrants from Sri Lanka (9.5%, a difference of 0.36%).
| Demographics | Rating | Rank | Receiving Food Stamps |
| Immigrants | Lithuania | 99.8 /100 | #29 | Exceptional 9.2% |
| Immigrants | Sweden | 99.7 /100 | #30 | Exceptional 9.3% |
| Immigrants | Eastern Asia | 99.7 /100 | #31 | Exceptional 9.3% |
| Bolivians | 99.7 /100 | #32 | Exceptional 9.3% |
| Zimbabweans | 99.6 /100 | #33 | Exceptional 9.5% |
| Turks | 99.6 /100 | #34 | Exceptional 9.5% |
| Immigrants | Austria | 99.6 /100 | #35 | Exceptional 9.5% |
| Estonians | 99.6 /100 | #36 | Exceptional 9.5% |
| Europeans | 99.6 /100 | #37 | Exceptional 9.5% |
| Immigrants | Sri Lanka | 99.5 /100 | #38 | Exceptional 9.5% |
| Immigrants | Bolivia | 99.5 /100 | #39 | Exceptional 9.5% |
| Immigrants | Netherlands | 99.5 /100 | #40 | Exceptional 9.5% |
| Cambodians | 99.5 /100 | #41 | Exceptional 9.5% |
| Immigrants | China | 99.5 /100 | #42 | Exceptional 9.6% |
| Croatians | 99.5 /100 | #43 | Exceptional 9.6% |