Australian vs Ecuadorian Receiving Food Stamps
COMPARE
Australian
Ecuadorian
Receiving Food Stamps
Receiving Food Stamps Comparison
Australians
Ecuadorians
9.6%
RECEIVING FOOD STAMPS
99.4/ 100
METRIC RATING
46th/ 347
METRIC RANK
14.9%
RECEIVING FOOD STAMPS
0.0/ 100
METRIC RATING
280th/ 347
METRIC RANK
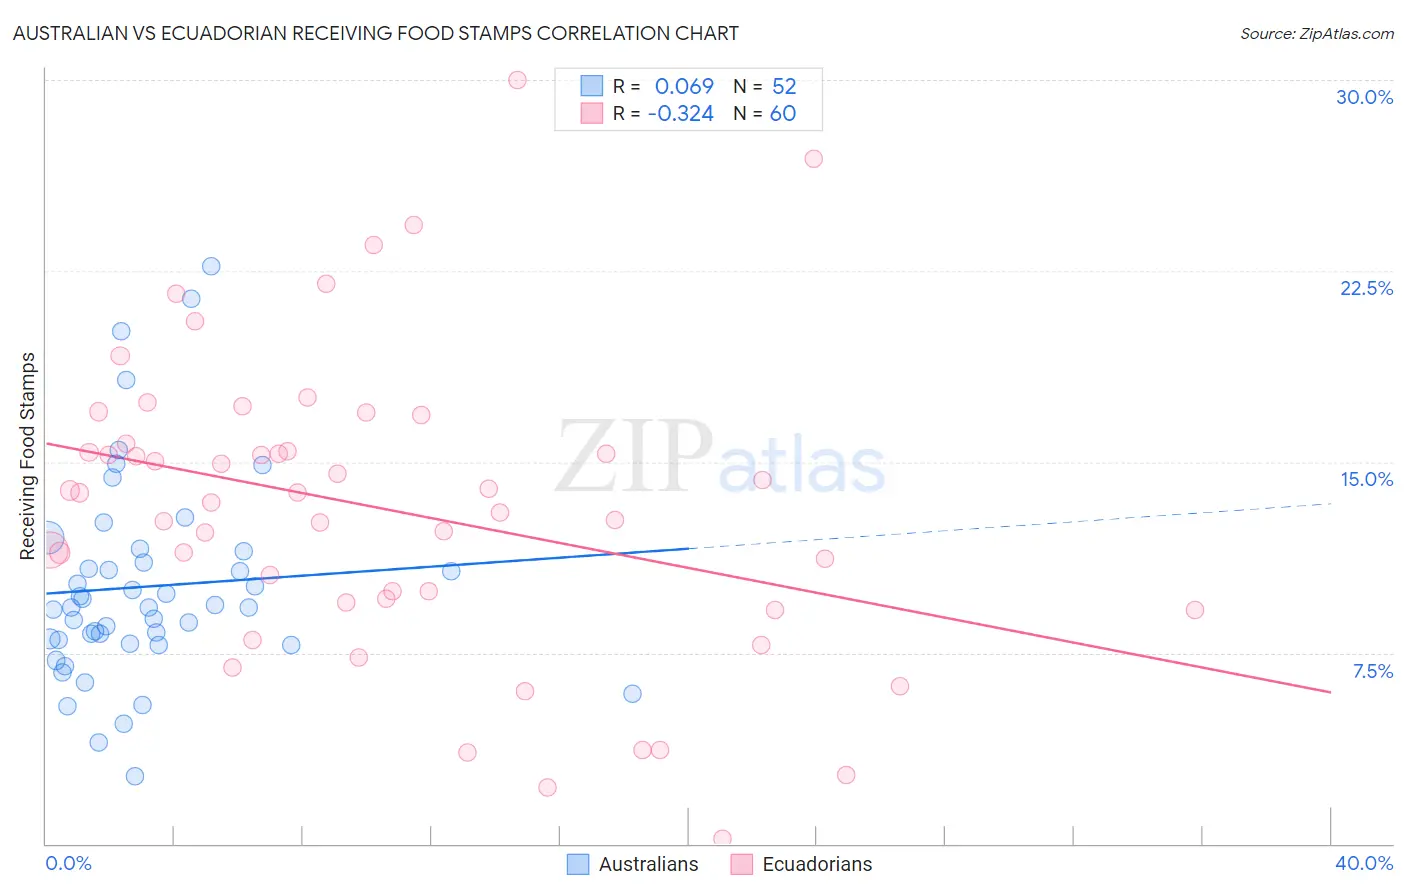
Australian vs Ecuadorian Receiving Food Stamps Correlation Chart
The statistical analysis conducted on geographies consisting of 223,620,943 people shows a slight positive correlation between the proportion of Australians and percentage of population receiving government assistance and/or food stamps in the United States with a correlation coefficient (R) of 0.069 and weighted average of 9.6%. Similarly, the statistical analysis conducted on geographies consisting of 317,062,012 people shows a mild negative correlation between the proportion of Ecuadorians and percentage of population receiving government assistance and/or food stamps in the United States with a correlation coefficient (R) of -0.324 and weighted average of 14.9%, a difference of 54.6%.
Receiving Food Stamps Correlation Summary
| Measurement | Australian | Ecuadorian |
| Minimum | 2.7% | 0.20% |
| Maximum | 22.7% | 30.0% |
| Range | 20.0% | 29.8% |
| Mean | 10.1% | 13.1% |
| Median | 9.3% | 13.6% |
| Interquartile 25% (IQ1) | 7.9% | 9.6% |
| Interquartile 75% (IQ3) | 11.3% | 15.6% |
| Interquartile Range (IQR) | 3.3% | 6.0% |
| Standard Deviation (Sample) | 4.1% | 5.9% |
| Standard Deviation (Population) | 4.0% | 5.9% |
Similar Demographics by Receiving Food Stamps
Demographics Similar to Australians by Receiving Food Stamps
In terms of receiving food stamps, the demographic groups most similar to Australians are Indian (Asian) (9.6%, a difference of 0.070%), Immigrants from Belgium (9.6%, a difference of 0.080%), Immigrants from Denmark (9.6%, a difference of 0.11%), Russian (9.6%, a difference of 0.17%), and Immigrants from Czechoslovakia (9.6%, a difference of 0.19%).
| Demographics | Rating | Rank | Receiving Food Stamps |
| Immigrants | Bolivia | 99.5 /100 | #39 | Exceptional 9.5% |
| Immigrants | Netherlands | 99.5 /100 | #40 | Exceptional 9.5% |
| Cambodians | 99.5 /100 | #41 | Exceptional 9.5% |
| Immigrants | China | 99.5 /100 | #42 | Exceptional 9.6% |
| Croatians | 99.5 /100 | #43 | Exceptional 9.6% |
| Immigrants | Denmark | 99.4 /100 | #44 | Exceptional 9.6% |
| Immigrants | Belgium | 99.4 /100 | #45 | Exceptional 9.6% |
| Australians | 99.4 /100 | #46 | Exceptional 9.6% |
| Indians (Asian) | 99.4 /100 | #47 | Exceptional 9.6% |
| Russians | 99.4 /100 | #48 | Exceptional 9.6% |
| Immigrants | Czechoslovakia | 99.4 /100 | #49 | Exceptional 9.6% |
| Lithuanians | 99.4 /100 | #50 | Exceptional 9.7% |
| Asians | 99.3 /100 | #51 | Exceptional 9.7% |
| Immigrants | South Africa | 99.3 /100 | #52 | Exceptional 9.7% |
| Tongans | 99.3 /100 | #53 | Exceptional 9.7% |
Demographics Similar to Ecuadorians by Receiving Food Stamps
In terms of receiving food stamps, the demographic groups most similar to Ecuadorians are Kiowa (14.9%, a difference of 0.050%), Belizean (14.8%, a difference of 0.32%), Spanish American Indian (14.9%, a difference of 0.32%), Seminole (14.8%, a difference of 0.45%), and Liberian (14.8%, a difference of 0.50%).
| Demographics | Rating | Rank | Receiving Food Stamps |
| Alaskan Athabascans | 0.1 /100 | #273 | Tragic 14.7% |
| Immigrants | Western Africa | 0.1 /100 | #274 | Tragic 14.7% |
| Ute | 0.1 /100 | #275 | Tragic 14.7% |
| Liberians | 0.1 /100 | #276 | Tragic 14.8% |
| Seminole | 0.1 /100 | #277 | Tragic 14.8% |
| Belizeans | 0.1 /100 | #278 | Tragic 14.8% |
| Kiowa | 0.0 /100 | #279 | Tragic 14.9% |
| Ecuadorians | 0.0 /100 | #280 | Tragic 14.9% |
| Spanish American Indians | 0.0 /100 | #281 | Tragic 14.9% |
| Immigrants | Central America | 0.0 /100 | #282 | Tragic 15.0% |
| Bangladeshis | 0.0 /100 | #283 | Tragic 15.0% |
| Immigrants | Ecuador | 0.0 /100 | #284 | Tragic 15.0% |
| Immigrants | Liberia | 0.0 /100 | #285 | Tragic 15.1% |
| Africans | 0.0 /100 | #286 | Tragic 15.1% |
| Immigrants | Mexico | 0.0 /100 | #287 | Tragic 15.2% |