Immigrants from Canada vs Ecuadorian Receiving Food Stamps
COMPARE
Immigrants from Canada
Ecuadorian
Receiving Food Stamps
Receiving Food Stamps Comparison
Immigrants from Canada
Ecuadorians
9.7%
RECEIVING FOOD STAMPS
99.3/ 100
METRIC RATING
56th/ 347
METRIC RANK
14.9%
RECEIVING FOOD STAMPS
0.0/ 100
METRIC RATING
280th/ 347
METRIC RANK
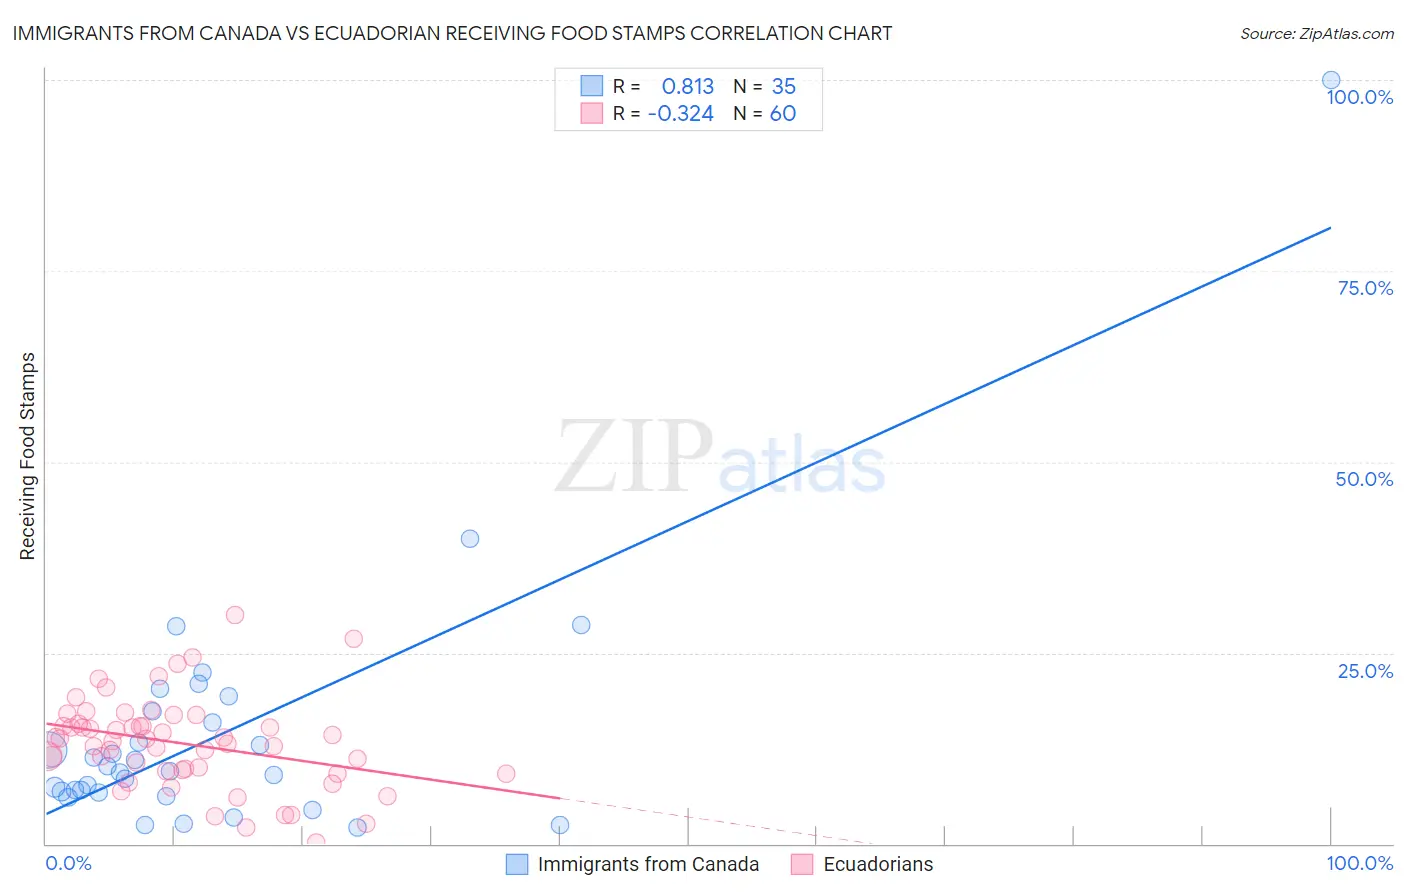
Immigrants from Canada vs Ecuadorian Receiving Food Stamps Correlation Chart
The statistical analysis conducted on geographies consisting of 457,609,455 people shows a very strong positive correlation between the proportion of Immigrants from Canada and percentage of population receiving government assistance and/or food stamps in the United States with a correlation coefficient (R) of 0.813 and weighted average of 9.7%. Similarly, the statistical analysis conducted on geographies consisting of 317,062,012 people shows a mild negative correlation between the proportion of Ecuadorians and percentage of population receiving government assistance and/or food stamps in the United States with a correlation coefficient (R) of -0.324 and weighted average of 14.9%, a difference of 53.1%.
Receiving Food Stamps Correlation Summary
| Measurement | Immigrants from Canada | Ecuadorian |
| Minimum | 2.1% | 0.20% |
| Maximum | 100.0% | 30.0% |
| Range | 97.9% | 29.8% |
| Mean | 14.4% | 13.1% |
| Median | 9.6% | 13.6% |
| Interquartile 25% (IQ1) | 6.7% | 9.6% |
| Interquartile 75% (IQ3) | 17.4% | 15.6% |
| Interquartile Range (IQR) | 10.7% | 6.0% |
| Standard Deviation (Sample) | 17.1% | 5.9% |
| Standard Deviation (Population) | 16.9% | 5.9% |
Similar Demographics by Receiving Food Stamps
Demographics Similar to Immigrants from Canada by Receiving Food Stamps
In terms of receiving food stamps, the demographic groups most similar to Immigrants from Canada are Greek (9.7%, a difference of 0.11%), Scandinavian (9.7%, a difference of 0.17%), Immigrants from Switzerland (9.7%, a difference of 0.18%), Swiss (9.7%, a difference of 0.19%), and British (9.7%, a difference of 0.20%).
| Demographics | Rating | Rank | Receiving Food Stamps |
| Immigrants | Czechoslovakia | 99.4 /100 | #49 | Exceptional 9.6% |
| Lithuanians | 99.4 /100 | #50 | Exceptional 9.7% |
| Asians | 99.3 /100 | #51 | Exceptional 9.7% |
| Immigrants | South Africa | 99.3 /100 | #52 | Exceptional 9.7% |
| Tongans | 99.3 /100 | #53 | Exceptional 9.7% |
| Swiss | 99.3 /100 | #54 | Exceptional 9.7% |
| Immigrants | Switzerland | 99.3 /100 | #55 | Exceptional 9.7% |
| Immigrants | Canada | 99.3 /100 | #56 | Exceptional 9.7% |
| Greeks | 99.3 /100 | #57 | Exceptional 9.7% |
| Scandinavians | 99.2 /100 | #58 | Exceptional 9.7% |
| British | 99.2 /100 | #59 | Exceptional 9.7% |
| Germans | 99.2 /100 | #60 | Exceptional 9.7% |
| English | 99.2 /100 | #61 | Exceptional 9.8% |
| Immigrants | Bulgaria | 99.2 /100 | #62 | Exceptional 9.8% |
| Chinese | 99.2 /100 | #63 | Exceptional 9.8% |
Demographics Similar to Ecuadorians by Receiving Food Stamps
In terms of receiving food stamps, the demographic groups most similar to Ecuadorians are Kiowa (14.9%, a difference of 0.050%), Belizean (14.8%, a difference of 0.32%), Spanish American Indian (14.9%, a difference of 0.32%), Seminole (14.8%, a difference of 0.45%), and Liberian (14.8%, a difference of 0.50%).
| Demographics | Rating | Rank | Receiving Food Stamps |
| Alaskan Athabascans | 0.1 /100 | #273 | Tragic 14.7% |
| Immigrants | Western Africa | 0.1 /100 | #274 | Tragic 14.7% |
| Ute | 0.1 /100 | #275 | Tragic 14.7% |
| Liberians | 0.1 /100 | #276 | Tragic 14.8% |
| Seminole | 0.1 /100 | #277 | Tragic 14.8% |
| Belizeans | 0.1 /100 | #278 | Tragic 14.8% |
| Kiowa | 0.0 /100 | #279 | Tragic 14.9% |
| Ecuadorians | 0.0 /100 | #280 | Tragic 14.9% |
| Spanish American Indians | 0.0 /100 | #281 | Tragic 14.9% |
| Immigrants | Central America | 0.0 /100 | #282 | Tragic 15.0% |
| Bangladeshis | 0.0 /100 | #283 | Tragic 15.0% |
| Immigrants | Ecuador | 0.0 /100 | #284 | Tragic 15.0% |
| Immigrants | Liberia | 0.0 /100 | #285 | Tragic 15.1% |
| Africans | 0.0 /100 | #286 | Tragic 15.1% |
| Immigrants | Mexico | 0.0 /100 | #287 | Tragic 15.2% |