Marshallese vs Ecuadorian Receiving Food Stamps
COMPARE
Marshallese
Ecuadorian
Receiving Food Stamps
Receiving Food Stamps Comparison
Marshallese
Ecuadorians
14.1%
RECEIVING FOOD STAMPS
0.3/ 100
METRIC RATING
254th/ 347
METRIC RANK
14.9%
RECEIVING FOOD STAMPS
0.0/ 100
METRIC RATING
280th/ 347
METRIC RANK
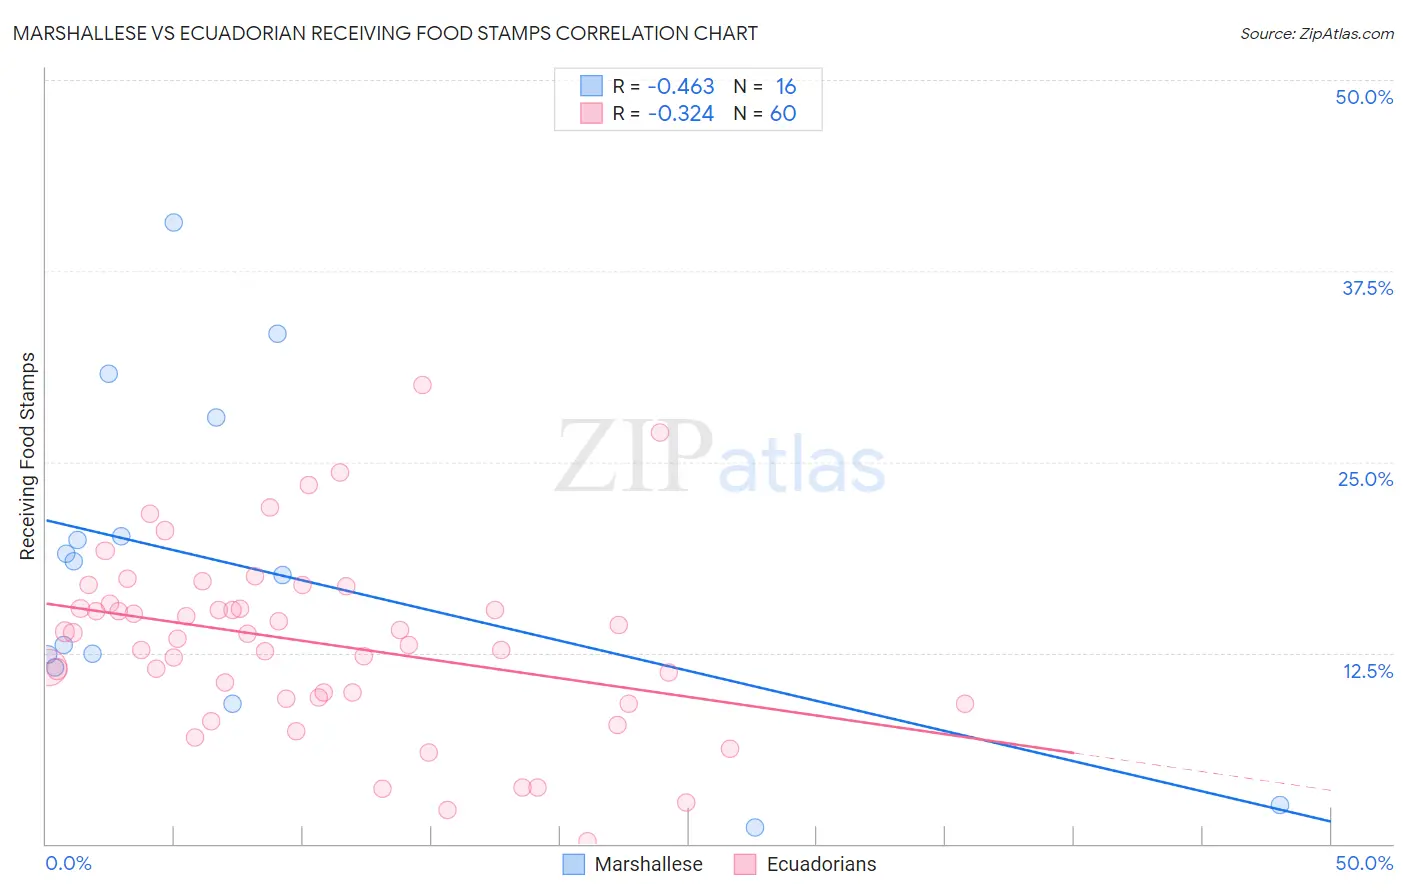
Marshallese vs Ecuadorian Receiving Food Stamps Correlation Chart
The statistical analysis conducted on geographies consisting of 14,761,315 people shows a moderate negative correlation between the proportion of Marshallese and percentage of population receiving government assistance and/or food stamps in the United States with a correlation coefficient (R) of -0.463 and weighted average of 14.1%. Similarly, the statistical analysis conducted on geographies consisting of 317,062,012 people shows a mild negative correlation between the proportion of Ecuadorians and percentage of population receiving government assistance and/or food stamps in the United States with a correlation coefficient (R) of -0.324 and weighted average of 14.9%, a difference of 5.6%.
Receiving Food Stamps Correlation Summary
| Measurement | Marshallese | Ecuadorian |
| Minimum | 1.1% | 0.20% |
| Maximum | 40.7% | 30.0% |
| Range | 39.6% | 29.8% |
| Mean | 18.1% | 13.1% |
| Median | 18.0% | 13.6% |
| Interquartile 25% (IQ1) | 12.0% | 9.6% |
| Interquartile 75% (IQ3) | 24.0% | 15.6% |
| Interquartile Range (IQR) | 12.0% | 6.0% |
| Standard Deviation (Sample) | 10.8% | 5.9% |
| Standard Deviation (Population) | 10.5% | 5.9% |
Similar Demographics by Receiving Food Stamps
Demographics Similar to Marshallese by Receiving Food Stamps
In terms of receiving food stamps, the demographic groups most similar to Marshallese are Subsaharan African (14.1%, a difference of 0.010%), Japanese (14.1%, a difference of 0.030%), Arapaho (14.1%, a difference of 0.14%), Immigrants from Ghana (14.1%, a difference of 0.21%), and Creek (14.1%, a difference of 0.34%).
| Demographics | Rating | Rank | Receiving Food Stamps |
| Mexican American Indians | 0.7 /100 | #247 | Tragic 13.8% |
| Immigrants | Laos | 0.7 /100 | #248 | Tragic 13.8% |
| Indonesians | 0.6 /100 | #249 | Tragic 13.9% |
| Immigrants | Cambodia | 0.5 /100 | #250 | Tragic 13.9% |
| Yaqui | 0.5 /100 | #251 | Tragic 13.9% |
| Ghanaians | 0.5 /100 | #252 | Tragic 14.0% |
| Spanish Americans | 0.4 /100 | #253 | Tragic 14.0% |
| Marshallese | 0.3 /100 | #254 | Tragic 14.1% |
| Sub-Saharan Africans | 0.3 /100 | #255 | Tragic 14.1% |
| Japanese | 0.3 /100 | #256 | Tragic 14.1% |
| Arapaho | 0.3 /100 | #257 | Tragic 14.1% |
| Immigrants | Ghana | 0.3 /100 | #258 | Tragic 14.1% |
| Creek | 0.3 /100 | #259 | Tragic 14.1% |
| Central Americans | 0.3 /100 | #260 | Tragic 14.1% |
| Immigrants | Congo | 0.3 /100 | #261 | Tragic 14.1% |
Demographics Similar to Ecuadorians by Receiving Food Stamps
In terms of receiving food stamps, the demographic groups most similar to Ecuadorians are Kiowa (14.9%, a difference of 0.050%), Belizean (14.8%, a difference of 0.32%), Spanish American Indian (14.9%, a difference of 0.32%), Seminole (14.8%, a difference of 0.45%), and Liberian (14.8%, a difference of 0.50%).
| Demographics | Rating | Rank | Receiving Food Stamps |
| Alaskan Athabascans | 0.1 /100 | #273 | Tragic 14.7% |
| Immigrants | Western Africa | 0.1 /100 | #274 | Tragic 14.7% |
| Ute | 0.1 /100 | #275 | Tragic 14.7% |
| Liberians | 0.1 /100 | #276 | Tragic 14.8% |
| Seminole | 0.1 /100 | #277 | Tragic 14.8% |
| Belizeans | 0.1 /100 | #278 | Tragic 14.8% |
| Kiowa | 0.0 /100 | #279 | Tragic 14.9% |
| Ecuadorians | 0.0 /100 | #280 | Tragic 14.9% |
| Spanish American Indians | 0.0 /100 | #281 | Tragic 14.9% |
| Immigrants | Central America | 0.0 /100 | #282 | Tragic 15.0% |
| Bangladeshis | 0.0 /100 | #283 | Tragic 15.0% |
| Immigrants | Ecuador | 0.0 /100 | #284 | Tragic 15.0% |
| Immigrants | Liberia | 0.0 /100 | #285 | Tragic 15.1% |
| Africans | 0.0 /100 | #286 | Tragic 15.1% |
| Immigrants | Mexico | 0.0 /100 | #287 | Tragic 15.2% |