Australian vs French American Indian Receiving Food Stamps
COMPARE
Australian
French American Indian
Receiving Food Stamps
Receiving Food Stamps Comparison
Australians
French American Indians
9.6%
RECEIVING FOOD STAMPS
99.4/ 100
METRIC RATING
46th/ 347
METRIC RANK
13.5%
RECEIVING FOOD STAMPS
1.4/ 100
METRIC RATING
238th/ 347
METRIC RANK
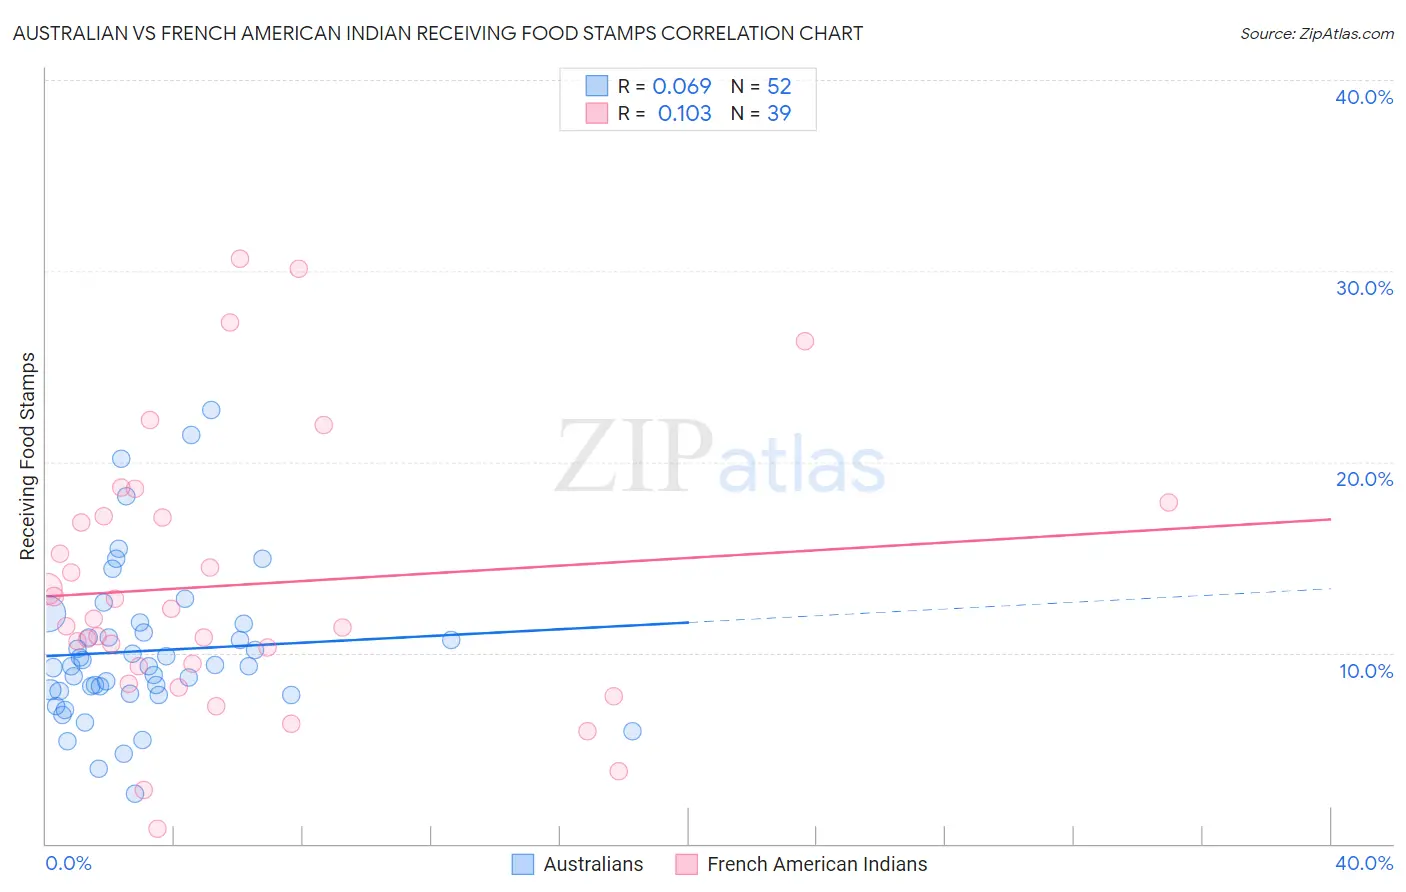
Australian vs French American Indian Receiving Food Stamps Correlation Chart
The statistical analysis conducted on geographies consisting of 223,620,943 people shows a slight positive correlation between the proportion of Australians and percentage of population receiving government assistance and/or food stamps in the United States with a correlation coefficient (R) of 0.069 and weighted average of 9.6%. Similarly, the statistical analysis conducted on geographies consisting of 131,914,702 people shows a poor positive correlation between the proportion of French American Indians and percentage of population receiving government assistance and/or food stamps in the United States with a correlation coefficient (R) of 0.103 and weighted average of 13.5%, a difference of 40.1%.
Receiving Food Stamps Correlation Summary
| Measurement | Australian | French American Indian |
| Minimum | 2.7% | 0.80% |
| Maximum | 22.7% | 30.7% |
| Range | 20.0% | 29.9% |
| Mean | 10.1% | 13.5% |
| Median | 9.3% | 11.8% |
| Interquartile 25% (IQ1) | 7.9% | 9.3% |
| Interquartile 75% (IQ3) | 11.3% | 17.1% |
| Interquartile Range (IQR) | 3.3% | 7.8% |
| Standard Deviation (Sample) | 4.1% | 7.0% |
| Standard Deviation (Population) | 4.0% | 7.0% |
Similar Demographics by Receiving Food Stamps
Demographics Similar to Australians by Receiving Food Stamps
In terms of receiving food stamps, the demographic groups most similar to Australians are Indian (Asian) (9.6%, a difference of 0.070%), Immigrants from Belgium (9.6%, a difference of 0.080%), Immigrants from Denmark (9.6%, a difference of 0.11%), Russian (9.6%, a difference of 0.17%), and Immigrants from Czechoslovakia (9.6%, a difference of 0.19%).
| Demographics | Rating | Rank | Receiving Food Stamps |
| Immigrants | Bolivia | 99.5 /100 | #39 | Exceptional 9.5% |
| Immigrants | Netherlands | 99.5 /100 | #40 | Exceptional 9.5% |
| Cambodians | 99.5 /100 | #41 | Exceptional 9.5% |
| Immigrants | China | 99.5 /100 | #42 | Exceptional 9.6% |
| Croatians | 99.5 /100 | #43 | Exceptional 9.6% |
| Immigrants | Denmark | 99.4 /100 | #44 | Exceptional 9.6% |
| Immigrants | Belgium | 99.4 /100 | #45 | Exceptional 9.6% |
| Australians | 99.4 /100 | #46 | Exceptional 9.6% |
| Indians (Asian) | 99.4 /100 | #47 | Exceptional 9.6% |
| Russians | 99.4 /100 | #48 | Exceptional 9.6% |
| Immigrants | Czechoslovakia | 99.4 /100 | #49 | Exceptional 9.6% |
| Lithuanians | 99.4 /100 | #50 | Exceptional 9.7% |
| Asians | 99.3 /100 | #51 | Exceptional 9.7% |
| Immigrants | South Africa | 99.3 /100 | #52 | Exceptional 9.7% |
| Tongans | 99.3 /100 | #53 | Exceptional 9.7% |
Demographics Similar to French American Indians by Receiving Food Stamps
In terms of receiving food stamps, the demographic groups most similar to French American Indians are Immigrants from El Salvador (13.5%, a difference of 0.20%), Immigrants from Micronesia (13.5%, a difference of 0.23%), Crow (13.4%, a difference of 0.42%), Iroquois (13.5%, a difference of 0.53%), and Immigrants from Zaire (13.4%, a difference of 0.87%).
| Demographics | Rating | Rank | Receiving Food Stamps |
| Immigrants | Nigeria | 3.4 /100 | #231 | Tragic 13.1% |
| Salvadorans | 2.7 /100 | #232 | Tragic 13.2% |
| Cherokee | 2.5 /100 | #233 | Tragic 13.2% |
| Comanche | 2.4 /100 | #234 | Tragic 13.3% |
| Immigrants | Zaire | 1.9 /100 | #235 | Tragic 13.4% |
| Crow | 1.6 /100 | #236 | Tragic 13.4% |
| Immigrants | El Salvador | 1.5 /100 | #237 | Tragic 13.5% |
| French American Indians | 1.4 /100 | #238 | Tragic 13.5% |
| Immigrants | Micronesia | 1.3 /100 | #239 | Tragic 13.5% |
| Iroquois | 1.2 /100 | #240 | Tragic 13.5% |
| Choctaw | 1.0 /100 | #241 | Tragic 13.6% |
| Immigrants | Panama | 1.0 /100 | #242 | Tragic 13.6% |
| Somalis | 0.9 /100 | #243 | Tragic 13.7% |
| Cajuns | 0.9 /100 | #244 | Tragic 13.7% |
| Immigrants | Somalia | 0.9 /100 | #245 | Tragic 13.7% |