Australian vs Ecuadorian Single Female Poverty
COMPARE
Australian
Ecuadorian
Single Female Poverty
Single Female Poverty Comparison
Australians
Ecuadorians
20.3%
SINGLE FEMALE POVERTY
88.4/ 100
METRIC RATING
143rd/ 347
METRIC RANK
21.6%
SINGLE FEMALE POVERTY
12.3/ 100
METRIC RATING
215th/ 347
METRIC RANK
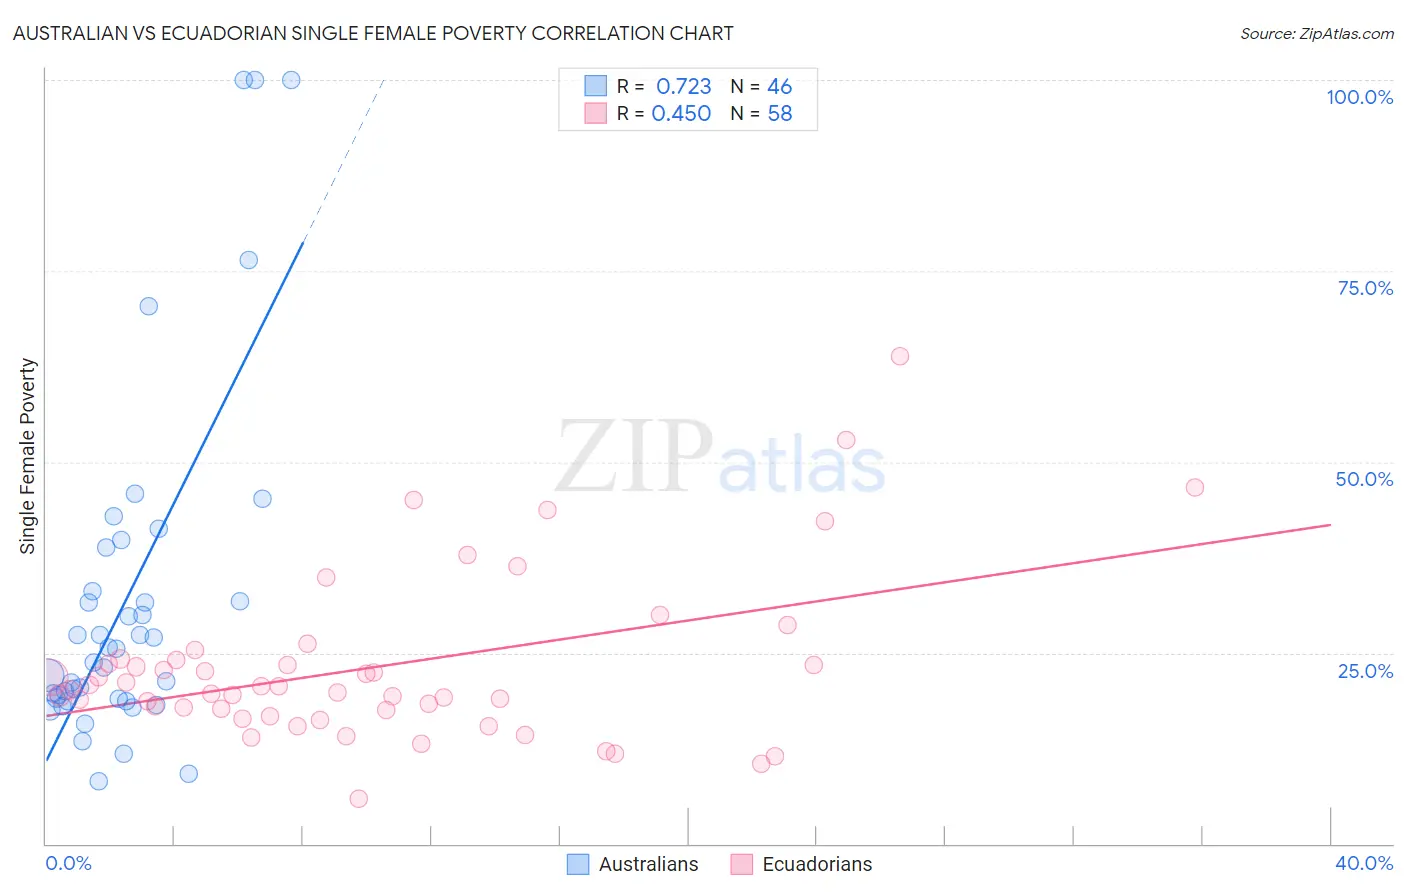
Australian vs Ecuadorian Single Female Poverty Correlation Chart
The statistical analysis conducted on geographies consisting of 221,875,753 people shows a strong positive correlation between the proportion of Australians and poverty level among single females in the United States with a correlation coefficient (R) of 0.723 and weighted average of 20.3%. Similarly, the statistical analysis conducted on geographies consisting of 313,951,403 people shows a moderate positive correlation between the proportion of Ecuadorians and poverty level among single females in the United States with a correlation coefficient (R) of 0.450 and weighted average of 21.6%, a difference of 6.4%.
Single Female Poverty Correlation Summary
| Measurement | Australian | Ecuadorian |
| Minimum | 8.1% | 5.9% |
| Maximum | 100.0% | 63.8% |
| Range | 91.9% | 57.9% |
| Mean | 31.8% | 23.1% |
| Median | 24.7% | 20.4% |
| Interquartile 25% (IQ1) | 19.0% | 17.5% |
| Interquartile 75% (IQ3) | 33.1% | 24.0% |
| Interquartile Range (IQR) | 14.1% | 6.5% |
| Standard Deviation (Sample) | 22.6% | 10.9% |
| Standard Deviation (Population) | 22.4% | 10.8% |
Similar Demographics by Single Female Poverty
Demographics Similar to Australians by Single Female Poverty
In terms of single female poverty, the demographic groups most similar to Australians are Immigrants from Uzbekistan (20.3%, a difference of 0.010%), Immigrants from Uganda (20.3%, a difference of 0.12%), Immigrants from North America (20.3%, a difference of 0.19%), Syrian (20.3%, a difference of 0.34%), and Immigrants from Kuwait (20.3%, a difference of 0.35%).
| Demographics | Rating | Rank | Single Female Poverty |
| Immigrants | Canada | 91.2 /100 | #136 | Exceptional 20.2% |
| Immigrants | Nepal | 90.6 /100 | #137 | Exceptional 20.3% |
| Slovenes | 90.5 /100 | #138 | Exceptional 20.3% |
| Immigrants | Kuwait | 90.4 /100 | #139 | Exceptional 20.3% |
| Syrians | 90.4 /100 | #140 | Exceptional 20.3% |
| Immigrants | North America | 89.5 /100 | #141 | Excellent 20.3% |
| Immigrants | Uganda | 89.1 /100 | #142 | Excellent 20.3% |
| Australians | 88.4 /100 | #143 | Excellent 20.3% |
| Immigrants | Uzbekistan | 88.3 /100 | #144 | Excellent 20.3% |
| Austrians | 85.8 /100 | #145 | Excellent 20.4% |
| Venezuelans | 85.5 /100 | #146 | Excellent 20.4% |
| South Africans | 85.3 /100 | #147 | Excellent 20.4% |
| Luxembourgers | 84.9 /100 | #148 | Excellent 20.4% |
| Portuguese | 81.5 /100 | #149 | Excellent 20.5% |
| Immigrants | Denmark | 80.5 /100 | #150 | Excellent 20.5% |
Demographics Similar to Ecuadorians by Single Female Poverty
In terms of single female poverty, the demographic groups most similar to Ecuadorians are Immigrants from Barbados (21.7%, a difference of 0.020%), Immigrants from St. Vincent and the Grenadines (21.7%, a difference of 0.090%), Immigrants from Nicaragua (21.6%, a difference of 0.13%), Guamanian/Chamorro (21.6%, a difference of 0.19%), and Jamaican (21.6%, a difference of 0.22%).
| Demographics | Rating | Rank | Single Female Poverty |
| Haitians | 15.4 /100 | #208 | Poor 21.6% |
| Immigrants | Eastern Africa | 15.1 /100 | #209 | Poor 21.6% |
| Immigrants | Panama | 14.4 /100 | #210 | Poor 21.6% |
| Icelanders | 14.0 /100 | #211 | Poor 21.6% |
| Jamaicans | 14.0 /100 | #212 | Poor 21.6% |
| Guamanians/Chamorros | 13.7 /100 | #213 | Poor 21.6% |
| Immigrants | Nicaragua | 13.3 /100 | #214 | Poor 21.6% |
| Ecuadorians | 12.3 /100 | #215 | Poor 21.6% |
| Immigrants | Barbados | 12.2 /100 | #216 | Poor 21.7% |
| Immigrants | St. Vincent and the Grenadines | 11.7 /100 | #217 | Poor 21.7% |
| Nepalese | 9.7 /100 | #218 | Tragic 21.7% |
| Panamanians | 9.4 /100 | #219 | Tragic 21.7% |
| Germans | 8.3 /100 | #220 | Tragic 21.8% |
| Immigrants | Grenada | 8.0 /100 | #221 | Tragic 21.8% |
| Immigrants | Eritrea | 7.9 /100 | #222 | Tragic 21.8% |