Native Hawaiian vs Hispanic or Latino Single Male Poverty
COMPARE
Native Hawaiian
Hispanic or Latino
Single Male Poverty
Single Male Poverty Comparison
Native Hawaiians
Hispanics or Latinos
12.6%
SINGLE MALE POVERTY
75.0/ 100
METRIC RATING
146th/ 347
METRIC RANK
14.2%
SINGLE MALE POVERTY
0.0/ 100
METRIC RATING
281st/ 347
METRIC RANK
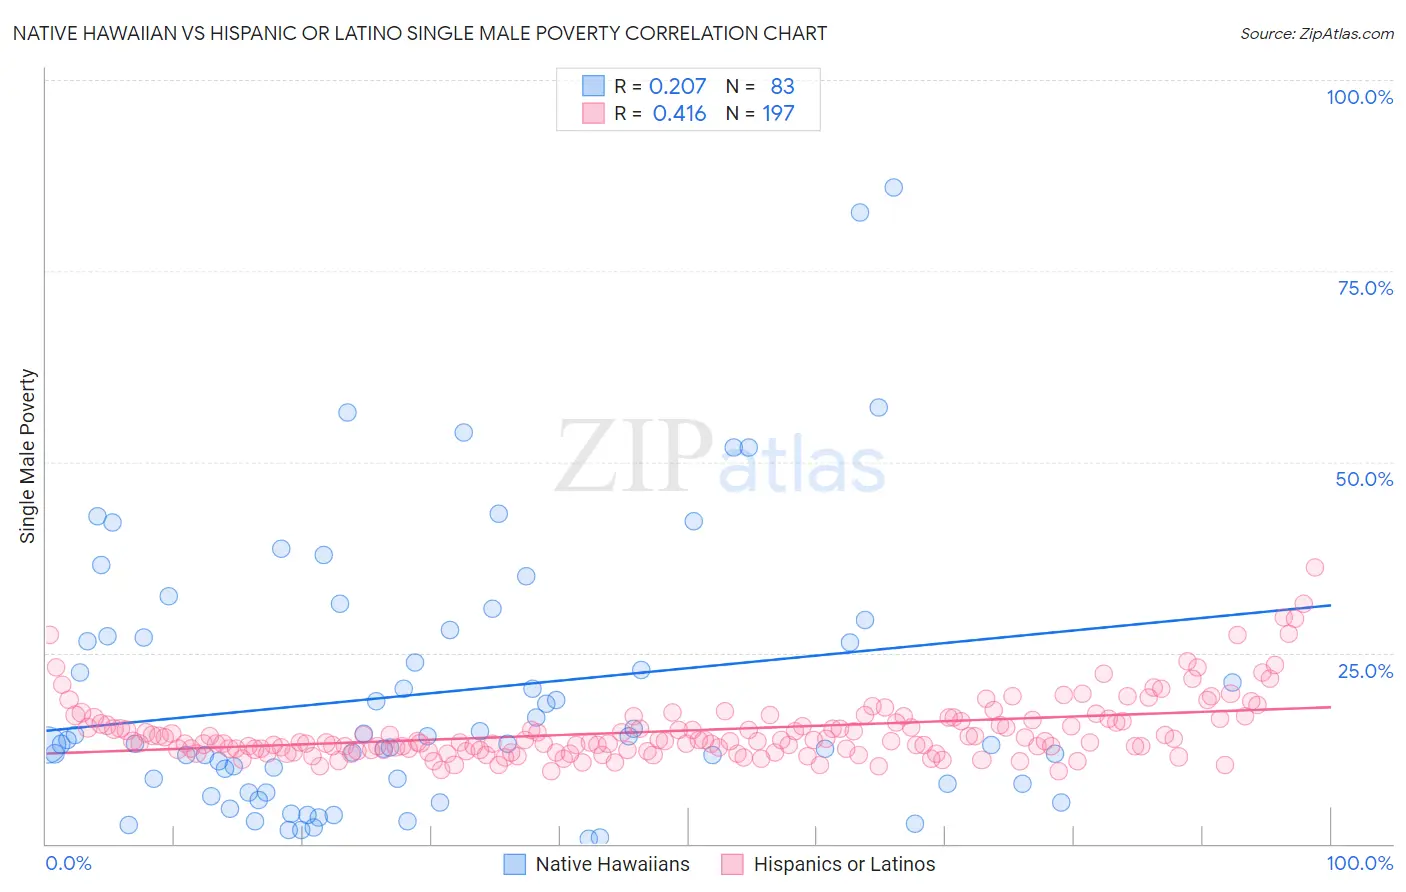
Native Hawaiian vs Hispanic or Latino Single Male Poverty Correlation Chart
The statistical analysis conducted on geographies consisting of 302,802,945 people shows a weak positive correlation between the proportion of Native Hawaiians and poverty level among single males in the United States with a correlation coefficient (R) of 0.207 and weighted average of 12.6%. Similarly, the statistical analysis conducted on geographies consisting of 473,841,382 people shows a moderate positive correlation between the proportion of Hispanics or Latinos and poverty level among single males in the United States with a correlation coefficient (R) of 0.416 and weighted average of 14.2%, a difference of 12.6%.
Single Male Poverty Correlation Summary
| Measurement | Native Hawaiian | Hispanic or Latino |
| Minimum | 0.72% | 9.5% |
| Maximum | 86.0% | 36.1% |
| Range | 85.3% | 26.6% |
| Mean | 19.8% | 14.8% |
| Median | 13.1% | 13.5% |
| Interquartile 25% (IQ1) | 7.9% | 12.3% |
| Interquartile 75% (IQ3) | 27.2% | 16.2% |
| Interquartile Range (IQR) | 19.3% | 3.8% |
| Standard Deviation (Sample) | 17.6% | 4.2% |
| Standard Deviation (Population) | 17.5% | 4.2% |
Similar Demographics by Single Male Poverty
Demographics Similar to Native Hawaiians by Single Male Poverty
In terms of single male poverty, the demographic groups most similar to Native Hawaiians are Immigrants from Lebanon (12.6%, a difference of 0.0%), Hawaiian (12.6%, a difference of 0.010%), Malaysian (12.6%, a difference of 0.010%), Immigrants from France (12.6%, a difference of 0.060%), and Okinawan (12.6%, a difference of 0.070%).
| Demographics | Rating | Rank | Single Male Poverty |
| Cubans | 79.9 /100 | #139 | Good 12.6% |
| Immigrants | Zimbabwe | 78.0 /100 | #140 | Good 12.6% |
| Okinawans | 75.9 /100 | #141 | Good 12.6% |
| Immigrants | Uganda | 75.9 /100 | #142 | Good 12.6% |
| Immigrants | France | 75.8 /100 | #143 | Good 12.6% |
| Hawaiians | 75.1 /100 | #144 | Good 12.6% |
| Immigrants | Lebanon | 75.0 /100 | #145 | Good 12.6% |
| Native Hawaiians | 75.0 /100 | #146 | Good 12.6% |
| Malaysians | 74.8 /100 | #147 | Good 12.6% |
| Yugoslavians | 73.9 /100 | #148 | Good 12.6% |
| Sierra Leoneans | 73.0 /100 | #149 | Good 12.6% |
| Immigrants | Panama | 72.1 /100 | #150 | Good 12.6% |
| Immigrants | Hungary | 71.9 /100 | #151 | Good 12.6% |
| Australians | 71.4 /100 | #152 | Good 12.6% |
| Immigrants | Immigrants | 70.1 /100 | #153 | Good 12.7% |
Demographics Similar to Hispanics or Latinos by Single Male Poverty
In terms of single male poverty, the demographic groups most similar to Hispanics or Latinos are Hmong (14.2%, a difference of 0.030%), Spanish American (14.2%, a difference of 0.16%), Yaqui (14.2%, a difference of 0.32%), Indonesian (14.1%, a difference of 0.73%), and Slovak (14.1%, a difference of 0.77%).
| Demographics | Rating | Rank | Single Male Poverty |
| Hondurans | 0.1 /100 | #274 | Tragic 14.0% |
| English | 0.1 /100 | #275 | Tragic 14.1% |
| Dutch | 0.1 /100 | #276 | Tragic 14.1% |
| Immigrants | Honduras | 0.0 /100 | #277 | Tragic 14.1% |
| Slovaks | 0.0 /100 | #278 | Tragic 14.1% |
| Indonesians | 0.0 /100 | #279 | Tragic 14.1% |
| Hmong | 0.0 /100 | #280 | Tragic 14.2% |
| Hispanics or Latinos | 0.0 /100 | #281 | Tragic 14.2% |
| Spanish Americans | 0.0 /100 | #282 | Tragic 14.2% |
| Yaqui | 0.0 /100 | #283 | Tragic 14.2% |
| Immigrants | Bahamas | 0.0 /100 | #284 | Tragic 14.4% |
| French | 0.0 /100 | #285 | Tragic 14.4% |
| Celtics | 0.0 /100 | #286 | Tragic 14.5% |
| Iroquois | 0.0 /100 | #287 | Tragic 14.5% |
| Whites/Caucasians | 0.0 /100 | #288 | Tragic 14.5% |