Yaqui vs Immigrants from Syria Single Father Poverty
COMPARE
Yaqui
Immigrants from Syria
Single Father Poverty
Single Father Poverty Comparison
Yaqui
Immigrants from Syria
15.6%
SINGLE FATHER POVERTY
98.1/ 100
METRIC RATING
97th/ 347
METRIC RANK
15.9%
SINGLE FATHER POVERTY
89.5/ 100
METRIC RATING
133rd/ 347
METRIC RANK
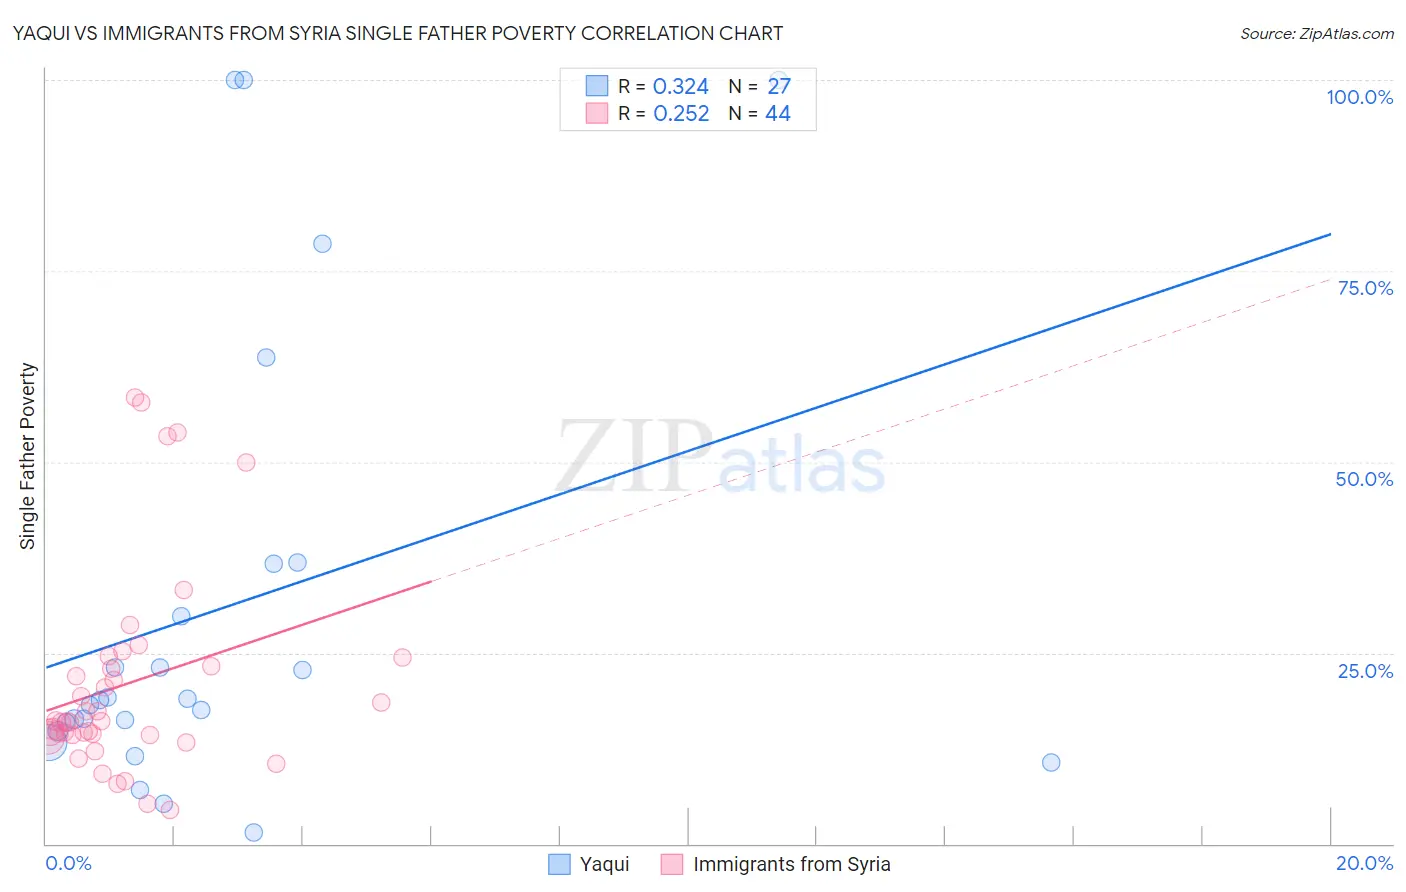
Yaqui vs Immigrants from Syria Single Father Poverty Correlation Chart
The statistical analysis conducted on geographies consisting of 98,465,633 people shows a mild positive correlation between the proportion of Yaqui and poverty level among single fathers in the United States with a correlation coefficient (R) of 0.324 and weighted average of 15.6%. Similarly, the statistical analysis conducted on geographies consisting of 149,904,118 people shows a weak positive correlation between the proportion of Immigrants from Syria and poverty level among single fathers in the United States with a correlation coefficient (R) of 0.252 and weighted average of 15.9%, a difference of 2.1%.
Single Father Poverty Correlation Summary
| Measurement | Yaqui | Immigrants from Syria |
| Minimum | 1.4% | 4.4% |
| Maximum | 100.0% | 58.5% |
| Range | 98.6% | 54.1% |
| Mean | 30.9% | 21.0% |
| Median | 18.8% | 16.0% |
| Interquartile 25% (IQ1) | 14.8% | 14.3% |
| Interquartile 75% (IQ3) | 36.7% | 23.8% |
| Interquartile Range (IQR) | 22.0% | 9.5% |
| Standard Deviation (Sample) | 29.8% | 13.6% |
| Standard Deviation (Population) | 29.2% | 13.4% |
Similar Demographics by Single Father Poverty
Demographics Similar to Yaqui by Single Father Poverty
In terms of single father poverty, the demographic groups most similar to Yaqui are Immigrants from Belgium (15.6%, a difference of 0.010%), Zimbabwean (15.6%, a difference of 0.010%), Immigrants from Kazakhstan (15.6%, a difference of 0.020%), Immigrants from Uruguay (15.6%, a difference of 0.070%), and Basque (15.5%, a difference of 0.21%).
| Demographics | Rating | Rank | Single Father Poverty |
| Mexican American Indians | 98.7 /100 | #90 | Exceptional 15.5% |
| Immigrants | Romania | 98.6 /100 | #91 | Exceptional 15.5% |
| Immigrants | Serbia | 98.5 /100 | #92 | Exceptional 15.5% |
| Basques | 98.4 /100 | #93 | Exceptional 15.5% |
| Immigrants | Uruguay | 98.2 /100 | #94 | Exceptional 15.6% |
| Immigrants | Kazakhstan | 98.2 /100 | #95 | Exceptional 15.6% |
| Immigrants | Belgium | 98.1 /100 | #96 | Exceptional 15.6% |
| Yaqui | 98.1 /100 | #97 | Exceptional 15.6% |
| Zimbabweans | 98.1 /100 | #98 | Exceptional 15.6% |
| Immigrants | Middle Africa | 97.4 /100 | #99 | Exceptional 15.6% |
| Immigrants | Chile | 96.9 /100 | #100 | Exceptional 15.7% |
| Fijians | 96.8 /100 | #101 | Exceptional 15.7% |
| Chileans | 96.4 /100 | #102 | Exceptional 15.7% |
| South American Indians | 96.2 /100 | #103 | Exceptional 15.7% |
| Australians | 96.1 /100 | #104 | Exceptional 15.7% |
Demographics Similar to Immigrants from Syria by Single Father Poverty
In terms of single father poverty, the demographic groups most similar to Immigrants from Syria are Immigrants from Portugal (15.9%, a difference of 0.020%), Nicaraguan (15.9%, a difference of 0.070%), Norwegian (15.9%, a difference of 0.080%), Immigrants from South America (15.9%, a difference of 0.12%), and Immigrants from Sri Lanka (15.9%, a difference of 0.15%).
| Demographics | Rating | Rank | Single Father Poverty |
| Hmong | 91.1 /100 | #126 | Exceptional 15.9% |
| Immigrants | Liberia | 91.1 /100 | #127 | Exceptional 15.9% |
| Immigrants | Nigeria | 90.8 /100 | #128 | Exceptional 15.9% |
| Immigrants | West Indies | 90.8 /100 | #129 | Exceptional 15.9% |
| Norwegians | 90.2 /100 | #130 | Exceptional 15.9% |
| Nicaraguans | 90.1 /100 | #131 | Exceptional 15.9% |
| Immigrants | Portugal | 89.7 /100 | #132 | Excellent 15.9% |
| Immigrants | Syria | 89.5 /100 | #133 | Excellent 15.9% |
| Immigrants | South America | 88.5 /100 | #134 | Excellent 15.9% |
| Immigrants | Sri Lanka | 88.2 /100 | #135 | Excellent 15.9% |
| Cypriots | 87.5 /100 | #136 | Excellent 15.9% |
| Immigrants | Azores | 87.2 /100 | #137 | Excellent 15.9% |
| Central Americans | 87.1 /100 | #138 | Excellent 16.0% |
| South Americans | 85.9 /100 | #139 | Excellent 16.0% |
| Immigrants | Netherlands | 85.3 /100 | #140 | Excellent 16.0% |