Arab vs Immigrants from Southern Europe Male Poverty

COMPARE

Arab
Race
Ancestry
AfghanAfricanAlaska NativeAlaskan AthabascanAlbanianAleutAlsatianAmericanApacheArabArapahoArgentineanArmenianAssyrian/Chaldean/SyriacAustralianAustrianBahamianBangladeshiBarbadianBasqueBelgianBelizeanBermudanBhutaneseBlackfeetBolivianBrazilianBritishBritish West IndianBulgarianBurmeseCajunCambodianCanadianCape VerdeanCarpatho RusynCelticCentral AmericanCentral American IndianCherokeeCheyenneChickasawChileanChineseChippewaChoctawColombianColvilleComancheCosta RicanCreeCreekCroatianCrowCubanCypriotCzechCzechoslovakianDanishDelawareDominicanDutchDutch West IndianEastern EuropeanEcuadorianEgyptianEnglishEstonianEthiopianEuropeanFijianFilipinoFinnishFrenchFrench American IndianFrench CanadianGermanGerman RussianGhanaianGreekGuamanian/ChamorroGuatemalanGuyaneseHaitianHmongHonduranHopiHoumaHungarianIcelanderIndian (Asian)IndonesianInupiatIranianIraqiIrishIroquoisIsraeliItalianJamaicanJapaneseJordanianKenyanKiowaKoreanLaotianLatvianLebaneseLiberianLithuanianLumbeeLuxembourgerMacedonianMalaysianMalteseMarshalleseMenomineeMexicanMexican American IndianMongolianMoroccanNative HawaiianNavajoNepaleseNew ZealanderNicaraguanNigerianNorthern EuropeanNorwegianOkinawanOsageOttawaPaiutePakistaniPalestinianPanamanianParaguayanPennsylvania GermanPeruvianPimaPolishPortuguesePotawatomiPuebloPuerto RicanPuget Sound SalishRomanianRussianSalvadoranSamoanScandinavianScotch-IrishScottishSeminoleSenegaleseSerbianShoshoneSierra LeoneanSiouxSlavicSlovakSloveneSomaliSouth AfricanSouth AmericanSouth American IndianSoviet UnionSpaniardSpanishSpanish AmericanSpanish American IndianSri LankanSubsaharan AfricanSudaneseSwedishSwissSyrianTaiwaneseThaiTlingit-HaidaTohono O'OdhamTonganTrinidadian and TobagonianTsimshianTurkishU.S. Virgin IslanderUgandanUkrainianUruguayanUteVenezuelanVietnameseWelshWest IndianYakamaYaquiYugoslavianYumanYup'ikZimbabwean
Immigration
NonimmigrantsImmigrantsAfghanistanAfricaAlbaniaArgentinaArmeniaAsiaAustraliaAustriaBahamasBangladeshBarbadosBelarusBelgiumBelizeBoliviaBosnia and HerzegovinaBrazilBulgariaBurma/MyanmarCabo VerdeCambodiaCameroonCanadaCaribbeanCentral AmericaChileChinaColombiaCongoCosta RicaCroatiaCubaCzechoslovakiaDenmarkDominicaDominican RepublicEastern AfricaEastern AsiaEastern EuropeEcuadorEgyptEl SalvadorEnglandEritreaEthiopiaEuropeFijiFranceGermanyGhanaGreeceGrenadaGuatemalaGuyanaHaitiHondurasHong KongHungaryIndiaIndonesiaIranIraqIrelandIsraelItalyJamaicaJapanJordanKazakhstanKenyaKoreaKuwaitLaosLatin AmericaLatviaLebanonLiberiaLithuaniaMalaysiaMexicoMicronesiaMiddle AfricaMoldovaMoroccoNepalNetherlandsNicaraguaNigeriaNorth AmericaNorth MacedoniaNorthern AfricaNorthern EuropeNorwayOceaniaPakistanPanamaPeruPhilippinesPolandPortugalRomaniaRussiaSaudi ArabiaScotlandSenegalSerbiaSierra LeoneSingaporeSomaliaSouth AfricaSouth AmericaSouth Central AsiaSouth Eastern AsiaSpainSri LankaSt. Vincent and the GrenadinesSudanSwedenSwitzerlandSyriaTaiwanThailandTrinidad and TobagoTurkeyUgandaUkraineUruguayUzbekistanVenezuelaVietnamWest IndiesWestern AfricaWestern AsiaWestern EuropeYemenZaireZimbabweAzores
Immigrants from Southern Europe
Race
Ancestry
AfghanAfricanAlaska NativeAlaskan AthabascanAlbanianAleutAlsatianAmericanApacheArapahoArgentineanArmenianAssyrian/Chaldean/SyriacAustralianAustrianBahamianBangladeshiBarbadianBasqueBelgianBelizeanBermudanBhutaneseBlackfeetBolivianBrazilianBritishBritish West IndianBulgarianBurmeseCajunCambodianCanadianCape VerdeanCarpatho RusynCelticCentral AmericanCentral American IndianCherokeeCheyenneChickasawChileanChineseChippewaChoctawColombianColvilleComancheCosta RicanCreeCreekCroatianCrowCubanCypriotCzechCzechoslovakianDanishDelawareDominicanDutchDutch West IndianEastern EuropeanEcuadorianEgyptianEnglishEstonianEthiopianEuropeanFijianFilipinoFinnishFrenchFrench American IndianFrench CanadianGermanGerman RussianGhanaianGreekGuamanian/ChamorroGuatemalanGuyaneseHaitianHmongHonduranHopiHoumaHungarianIcelanderIndian (Asian)IndonesianInupiatIranianIraqiIrishIroquoisIsraeliItalianJamaicanJapaneseJordanianKenyanKiowaKoreanLaotianLatvianLebaneseLiberianLithuanianLumbeeLuxembourgerMacedonianMalaysianMalteseMarshalleseMenomineeMexicanMexican American IndianMongolianMoroccanNative HawaiianNavajoNepaleseNew ZealanderNicaraguanNigerianNorthern EuropeanNorwegianOkinawanOsageOttawaPaiutePakistaniPalestinianPanamanianParaguayanPennsylvania GermanPeruvianPimaPolishPortuguesePotawatomiPuebloPuerto RicanPuget Sound SalishRomanianRussianSalvadoranSamoanScandinavianScotch-IrishScottishSeminoleSenegaleseSerbianShoshoneSierra LeoneanSiouxSlavicSlovakSloveneSomaliSouth AfricanSouth AmericanSouth American IndianSoviet UnionSpaniardSpanishSpanish AmericanSpanish American IndianSri LankanSubsaharan AfricanSudaneseSwedishSwissSyrianTaiwaneseThaiTlingit-HaidaTohono O'OdhamTonganTrinidadian and TobagonianTsimshianTurkishU.S. Virgin IslanderUgandanUkrainianUruguayanUteVenezuelanVietnameseWelshWest IndianYakamaYaquiYugoslavianYumanYup'ikZimbabwean
Immigration
NonimmigrantsImmigrantsAfghanistanAfricaAlbaniaArgentinaArmeniaAsiaAustraliaAustriaBahamasBangladeshBarbadosBelarusBelgiumBelizeBoliviaBosnia and HerzegovinaBrazilBulgariaBurma/MyanmarCabo VerdeCambodiaCameroonCanadaCaribbeanCentral AmericaChileChinaColombiaCongoCosta RicaCroatiaCubaCzechoslovakiaDenmarkDominicaDominican RepublicEastern AfricaEastern AsiaEastern EuropeEcuadorEgyptEl SalvadorEnglandEritreaEthiopiaEuropeFijiFranceGermanyGhanaGreeceGrenadaGuatemalaGuyanaHaitiHondurasHong KongHungaryIndiaIndonesiaIranIraqIrelandIsraelItalyJamaicaJapanJordanKazakhstanKenyaKoreaKuwaitLaosLatin AmericaLatviaLebanonLiberiaLithuaniaMalaysiaMexicoMicronesiaMiddle AfricaMoldovaMoroccoNepalNetherlandsNicaraguaNigeriaNorth AmericaNorth MacedoniaNorthern AfricaNorthern EuropeNorwayOceaniaPakistanPanamaPeruPhilippinesPolandPortugalRomaniaRussiaSaudi ArabiaScotlandSenegalSerbiaSierra LeoneSingaporeSomaliaSouth AfricaSouth AmericaSouth Central AsiaSouth Eastern AsiaSouthern EuropeSpainSri LankaSt. Vincent and the GrenadinesSudanSwedenSwitzerlandSyriaTaiwanThailandTrinidad and TobagoTurkeyUgandaUkraineUruguayUzbekistanVenezuelaVietnamWest IndiesWestern AfricaWestern AsiaWestern EuropeYemenZaireZimbabweAzores
Male Poverty
Income
Poverty
Unemployment
Labor Participation
Family Structure
Vehicle Availability
Education Level
Disability

Male Poverty Comparison

Arabs

Immigrants from Southern Europe

Poor
Exceptional
11.6%
MALE POVERTY
15.8/ 100
METRIC RATING
195th/ 347
METRIC RANK
10.5%
MALE POVERTY
91.3/ 100
METRIC RATING
106th/ 347
METRIC RANK

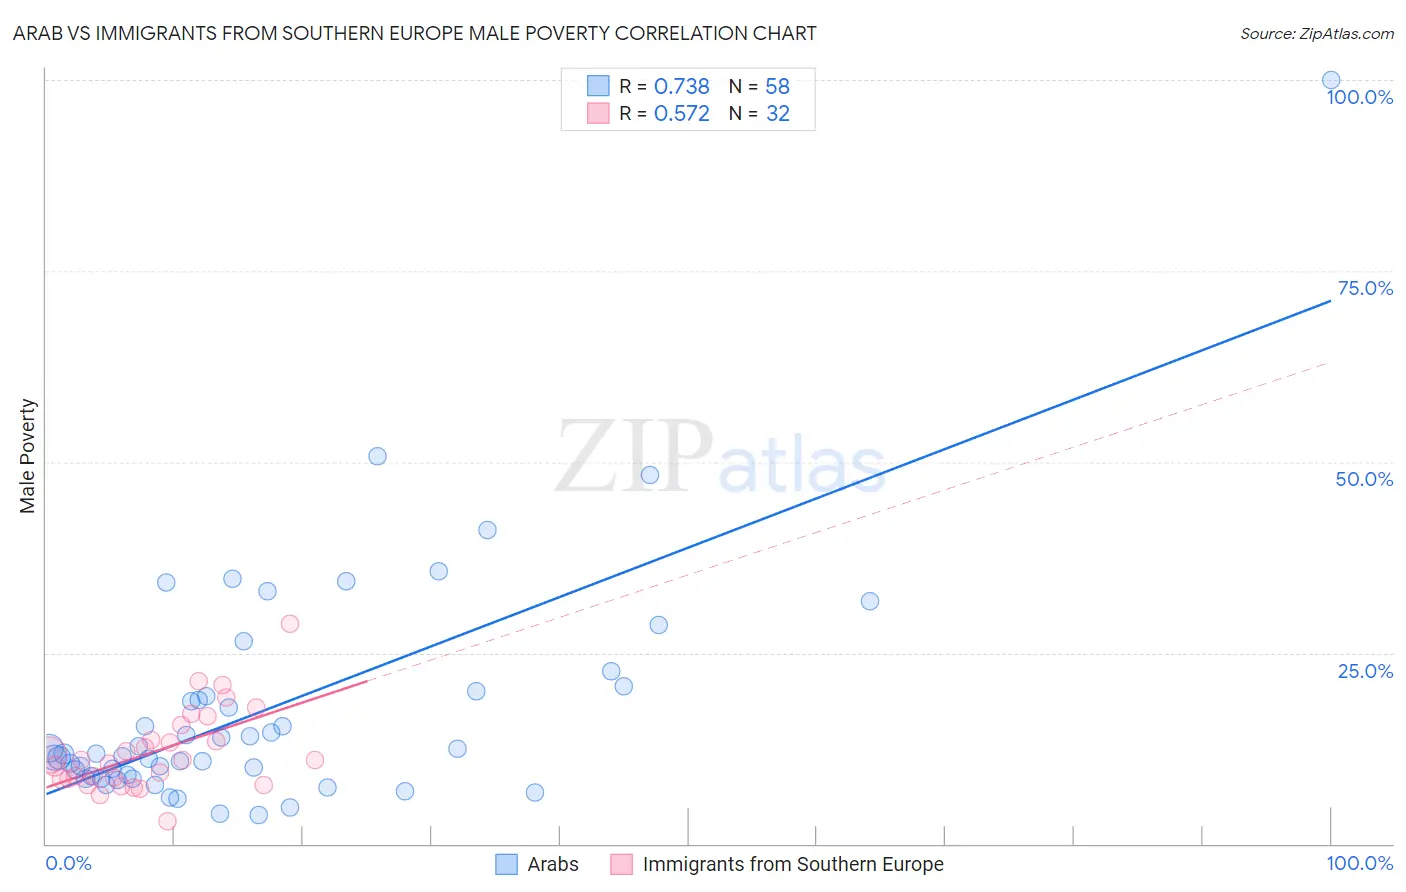
Arab vs Immigrants from Southern Europe Male Poverty Correlation Chart

The statistical analysis conducted on geographies consisting of 486,080,100 people shows a strong positive correlation between the proportion of Arabs and poverty level among males in the United States with a correlation coefficient (R) of 0.738 and weighted average of 11.6%. Similarly, the statistical analysis conducted on geographies consisting of 402,406,508 people shows a substantial positive correlation between the proportion of Immigrants from Southern Europe and poverty level among males in the United States with a correlation coefficient (R) of 0.572 and weighted average of 10.5%, a difference of 10.4%.
Arab vs Immigrants from Southern Europe Male Poverty

Male Poverty Correlation Summary

MeasurementArabImmigrants from Southern Europe
Minimum3.8%2.9%
Maximum100.0%28.8%
Range96.2%25.9%
Mean17.7%12.1%
Median11.7%10.9%
Interquartile 25% (IQ1)8.8%8.5%
Interquartile 75% (IQ3)20.0%14.6%
Interquartile Range (IQR)11.2%6.1%
Standard Deviation (Sample)15.6%5.4%
Standard Deviation (Population)15.5%5.3%

Similar Demographics by Male Poverty

Demographics Similar to Arabs by Male Poverty

In terms of male poverty, the demographic groups most similar to Arabs are Hmong (11.6%, a difference of 0.010%), Immigrants from Kenya (11.6%, a difference of 0.050%), Delaware (11.7%, a difference of 0.070%), Iraqi (11.7%, a difference of 0.21%), and Immigrants from Kuwait (11.6%, a difference of 0.26%).
DemographicsRating | RankMale Poverty
Sierra Leoneans
29.9
/100
|
#188
Fair
11.4%
Hawaiians
28.3
/100
|
#189
Fair
11.4%
Israelis
26.1
/100
|
#190
Fair
11.5%
South American Indians
22.8
/100
|
#191
Fair
11.5%
Immigrants | Uruguay
19.1
/100
|
#192
Poor
11.6%
Immigrants | Kuwait
17.3
/100
|
#193
Poor
11.6%
Immigrants | Kenya
16.1
/100
|
#194
Poor
11.6%
Arabs
15.8
/100
|
#195
Poor
11.6%
Hmong
15.8
/100
|
#196
Poor
11.6%
Delaware
15.4
/100
|
#197
Poor
11.7%
Iraqis
14.7
/100
|
#198
Poor
11.7%
Spanish
14.1
/100
|
#199
Poor
11.7%
Immigrants | Lebanon
13.6
/100
|
#200
Poor
11.7%
Spaniards
13.5
/100
|
#201
Poor
11.7%
Aleuts
10.4
/100
|
#202
Poor
11.8%

Demographics Similar to Immigrants from Southern Europe by Male Poverty

In terms of male poverty, the demographic groups most similar to Immigrants from Southern Europe are Laotian (10.5%, a difference of 0.010%), Portuguese (10.6%, a difference of 0.080%), Canadian (10.5%, a difference of 0.11%), Welsh (10.5%, a difference of 0.12%), and Slavic (10.5%, a difference of 0.13%).
DemographicsRating | RankMale Poverty
Immigrants | Indonesia
93.3
/100
|
#99
Exceptional
10.5%
Immigrants | Latvia
92.8
/100
|
#100
Exceptional
10.5%
Immigrants | Zimbabwe
92.0
/100
|
#101
Exceptional
10.5%
French Canadians
91.9
/100
|
#102
Exceptional
10.5%
Slavs
91.7
/100
|
#103
Exceptional
10.5%
Welsh
91.6
/100
|
#104
Exceptional
10.5%
Canadians
91.6
/100
|
#105
Exceptional
10.5%
Immigrants | Southern Europe
91.3
/100
|
#106
Exceptional
10.5%
Laotians
91.2
/100
|
#107
Exceptional
10.5%
Portuguese
91.0
/100
|
#108
Exceptional
10.6%
Albanians
90.6
/100
|
#109
Exceptional
10.6%
Argentineans
90.1
/100
|
#110
Exceptional
10.6%
Immigrants | Argentina
89.8
/100
|
#111
Excellent
10.6%
Immigrants | Turkey
89.5
/100
|
#112
Excellent
10.6%
Palestinians
89.1
/100
|
#113
Excellent
10.6%