Immigrants from Eastern Europe vs Argentinean Child Poverty Among Girls Under 16
COMPARE
Immigrants from Eastern Europe
Argentinean
Child Poverty Among Girls Under 16
Child Poverty Among Girls Under 16 Comparison
Immigrants from Eastern Europe
Argentineans
14.6%
CHILD POVERTY AMONG GIRLS UNDER 16
98.0/ 100
METRIC RATING
75th/ 347
METRIC RANK
14.7%
CHILD POVERTY AMONG GIRLS UNDER 16
97.9/ 100
METRIC RATING
78th/ 347
METRIC RANK
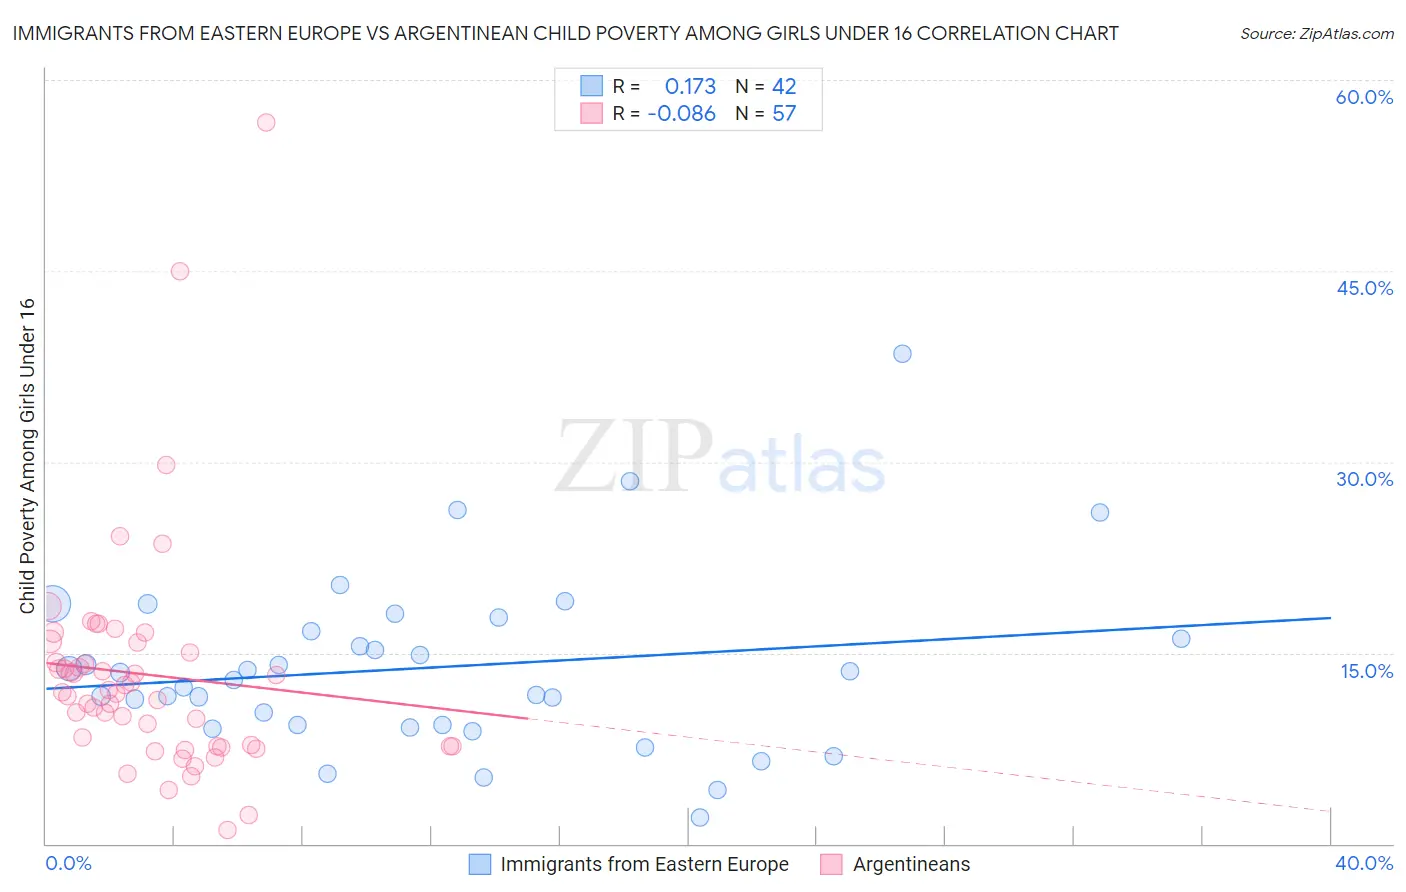
Immigrants from Eastern Europe vs Argentinean Child Poverty Among Girls Under 16 Correlation Chart
The statistical analysis conducted on geographies consisting of 462,372,791 people shows a poor positive correlation between the proportion of Immigrants from Eastern Europe and poverty level among girls under the age of 16 in the United States with a correlation coefficient (R) of 0.173 and weighted average of 14.6%. Similarly, the statistical analysis conducted on geographies consisting of 293,059,037 people shows a slight negative correlation between the proportion of Argentineans and poverty level among girls under the age of 16 in the United States with a correlation coefficient (R) of -0.086 and weighted average of 14.7%, a difference of 0.16%.
Child Poverty Among Girls Under 16 Correlation Summary
| Measurement | Immigrants from Eastern Europe | Argentinean |
| Minimum | 2.1% | 1.1% |
| Maximum | 38.5% | 56.7% |
| Range | 36.4% | 55.6% |
| Mean | 13.8% | 13.3% |
| Median | 13.1% | 11.9% |
| Interquartile 25% (IQ1) | 9.3% | 7.7% |
| Interquartile 75% (IQ3) | 16.7% | 15.4% |
| Interquartile Range (IQR) | 7.4% | 7.7% |
| Standard Deviation (Sample) | 6.9% | 9.0% |
| Standard Deviation (Population) | 6.8% | 8.9% |
Demographics Similar to Immigrants from Eastern Europe and Argentineans by Child Poverty Among Girls Under 16
In terms of child poverty among girls under 16, the demographic groups most similar to Immigrants from Eastern Europe are Taiwanese (14.6%, a difference of 0.070%), Immigrants from Austria (14.6%, a difference of 0.10%), Immigrants from Russia (14.7%, a difference of 0.15%), Tlingit-Haida (14.7%, a difference of 0.16%), and Immigrants from Turkey (14.7%, a difference of 0.18%). Similarly, the demographic groups most similar to Argentineans are Tlingit-Haida (14.7%, a difference of 0.010%), Immigrants from Russia (14.7%, a difference of 0.020%), Immigrants from Turkey (14.7%, a difference of 0.020%), Egyptian (14.7%, a difference of 0.020%), and Ukrainian (14.7%, a difference of 0.21%).
| Demographics | Rating | Rank | Child Poverty Among Girls Under 16 |
| Immigrants | Belgium | 98.5 /100 | #66 | Exceptional 14.5% |
| Laotians | 98.4 /100 | #67 | Exceptional 14.5% |
| Immigrants | Argentina | 98.3 /100 | #68 | Exceptional 14.6% |
| Immigrants | Poland | 98.2 /100 | #69 | Exceptional 14.6% |
| Europeans | 98.1 /100 | #70 | Exceptional 14.6% |
| Slovenes | 98.1 /100 | #71 | Exceptional 14.6% |
| Immigrants | Netherlands | 98.1 /100 | #72 | Exceptional 14.6% |
| Immigrants | Austria | 98.0 /100 | #73 | Exceptional 14.6% |
| Taiwanese | 98.0 /100 | #74 | Exceptional 14.6% |
| Immigrants | Eastern Europe | 98.0 /100 | #75 | Exceptional 14.6% |
| Immigrants | Russia | 97.9 /100 | #76 | Exceptional 14.7% |
| Tlingit-Haida | 97.9 /100 | #77 | Exceptional 14.7% |
| Argentineans | 97.9 /100 | #78 | Exceptional 14.7% |
| Immigrants | Turkey | 97.9 /100 | #79 | Exceptional 14.7% |
| Egyptians | 97.9 /100 | #80 | Exceptional 14.7% |
| Ukrainians | 97.7 /100 | #81 | Exceptional 14.7% |
| Macedonians | 97.6 /100 | #82 | Exceptional 14.7% |
| Immigrants | Italy | 97.4 /100 | #83 | Exceptional 14.8% |
| Soviet Union | 97.3 /100 | #84 | Exceptional 14.8% |
| Swiss | 97.2 /100 | #85 | Exceptional 14.8% |
| Australians | 97.2 /100 | #86 | Exceptional 14.8% |