Apache vs French American Indian Child Poverty Among Boys Under 16
COMPARE
Apache
French American Indian
Child Poverty Among Boys Under 16
Child Poverty Among Boys Under 16 Comparison
Apache
French American Indians
24.5%
CHILD POVERTY AMONG BOYS UNDER 16
0.0/ 100
METRIC RATING
333rd/ 347
METRIC RANK
19.2%
CHILD POVERTY AMONG BOYS UNDER 16
0.2/ 100
METRIC RATING
251st/ 347
METRIC RANK
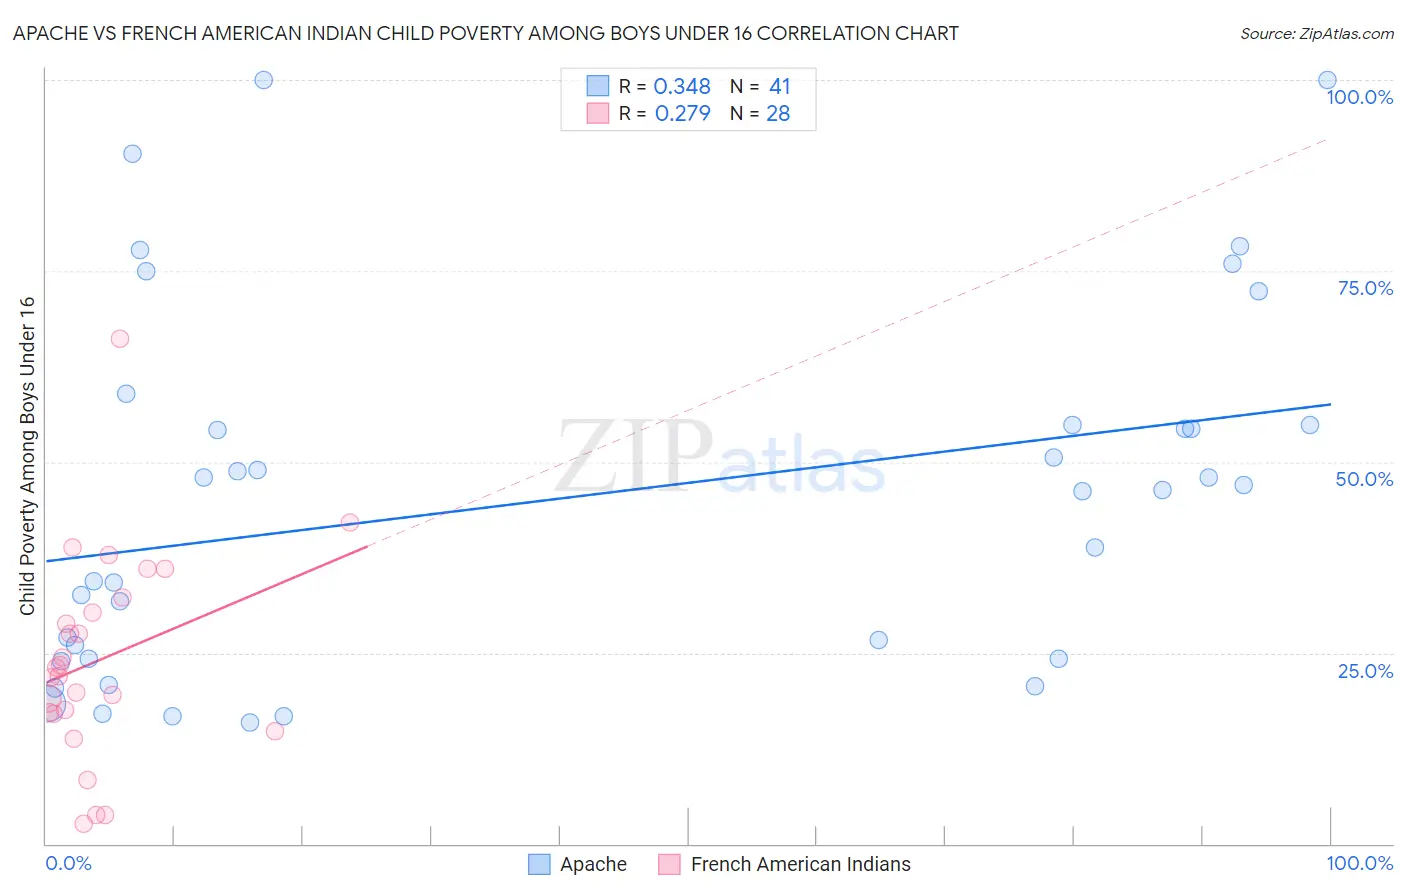
Apache vs French American Indian Child Poverty Among Boys Under 16 Correlation Chart
The statistical analysis conducted on geographies consisting of 229,742,001 people shows a mild positive correlation between the proportion of Apache and poverty level among boys under the age of 16 in the United States with a correlation coefficient (R) of 0.348 and weighted average of 24.5%. Similarly, the statistical analysis conducted on geographies consisting of 131,081,352 people shows a weak positive correlation between the proportion of French American Indians and poverty level among boys under the age of 16 in the United States with a correlation coefficient (R) of 0.279 and weighted average of 19.2%, a difference of 27.5%.
Child Poverty Among Boys Under 16 Correlation Summary
| Measurement | Apache | French American Indian |
| Minimum | 15.9% | 2.5% |
| Maximum | 100.0% | 66.1% |
| Range | 84.1% | 63.6% |
| Mean | 45.2% | 24.1% |
| Median | 46.3% | 22.5% |
| Interquartile 25% (IQ1) | 24.3% | 17.1% |
| Interquartile 75% (IQ3) | 54.8% | 31.3% |
| Interquartile Range (IQR) | 30.6% | 14.2% |
| Standard Deviation (Sample) | 23.6% | 13.4% |
| Standard Deviation (Population) | 23.3% | 13.2% |
Similar Demographics by Child Poverty Among Boys Under 16
Demographics Similar to Apache by Child Poverty Among Boys Under 16
In terms of child poverty among boys under 16, the demographic groups most similar to Apache are Black/African American (24.5%, a difference of 0.12%), Immigrants from Dominican Republic (24.3%, a difference of 0.72%), Yup'ik (24.7%, a difference of 0.97%), Dominican (24.2%, a difference of 1.3%), and Colville (24.1%, a difference of 1.7%).
| Demographics | Rating | Rank | Child Poverty Among Boys Under 16 |
| Paiute | 0.0 /100 | #326 | Tragic 22.8% |
| Immigrants | Honduras | 0.0 /100 | #327 | Tragic 22.8% |
| Pueblo | 0.0 /100 | #328 | Tragic 23.5% |
| Natives/Alaskans | 0.0 /100 | #329 | Tragic 24.0% |
| Colville | 0.0 /100 | #330 | Tragic 24.1% |
| Dominicans | 0.0 /100 | #331 | Tragic 24.2% |
| Immigrants | Dominican Republic | 0.0 /100 | #332 | Tragic 24.3% |
| Apache | 0.0 /100 | #333 | Tragic 24.5% |
| Blacks/African Americans | 0.0 /100 | #334 | Tragic 24.5% |
| Yup'ik | 0.0 /100 | #335 | Tragic 24.7% |
| Sioux | 0.0 /100 | #336 | Tragic 25.3% |
| Cheyenne | 0.0 /100 | #337 | Tragic 25.8% |
| Hopi | 0.0 /100 | #338 | Tragic 25.9% |
| Houma | 0.0 /100 | #339 | Tragic 26.2% |
| Crow | 0.0 /100 | #340 | Tragic 26.3% |
Demographics Similar to French American Indians by Child Poverty Among Boys Under 16
In terms of child poverty among boys under 16, the demographic groups most similar to French American Indians are Immigrants from Burma/Myanmar (19.2%, a difference of 0.030%), Immigrants from Western Africa (19.3%, a difference of 0.23%), Liberian (19.3%, a difference of 0.30%), Trinidadian and Tobagonian (19.3%, a difference of 0.57%), and Ecuadorian (19.3%, a difference of 0.57%).
| Demographics | Rating | Rank | Child Poverty Among Boys Under 16 |
| Immigrants | Middle Africa | 0.4 /100 | #244 | Tragic 18.9% |
| Cree | 0.4 /100 | #245 | Tragic 19.0% |
| Immigrants | Nicaragua | 0.4 /100 | #246 | Tragic 19.0% |
| Immigrants | Trinidad and Tobago | 0.3 /100 | #247 | Tragic 19.0% |
| Salvadorans | 0.3 /100 | #248 | Tragic 19.0% |
| Alsatians | 0.3 /100 | #249 | Tragic 19.1% |
| Immigrants | Burma/Myanmar | 0.2 /100 | #250 | Tragic 19.2% |
| French American Indians | 0.2 /100 | #251 | Tragic 19.2% |
| Immigrants | Western Africa | 0.2 /100 | #252 | Tragic 19.3% |
| Liberians | 0.2 /100 | #253 | Tragic 19.3% |
| Trinidadians and Tobagonians | 0.2 /100 | #254 | Tragic 19.3% |
| Ecuadorians | 0.2 /100 | #255 | Tragic 19.3% |
| Immigrants | Liberia | 0.2 /100 | #256 | Tragic 19.3% |
| Mexican American Indians | 0.2 /100 | #257 | Tragic 19.4% |
| Potawatomi | 0.2 /100 | #258 | Tragic 19.4% |