Immigrants from Uganda vs White/Caucasian Child Poverty Among Boys Under 16
COMPARE
Immigrants from Uganda
White/Caucasian
Child Poverty Among Boys Under 16
Child Poverty Among Boys Under 16 Comparison
Immigrants from Uganda
Whites/Caucasians
17.0%
CHILD POVERTY AMONG BOYS UNDER 16
21.6/ 100
METRIC RATING
192nd/ 347
METRIC RANK
16.5%
CHILD POVERTY AMONG BOYS UNDER 16
48.2/ 100
METRIC RATING
176th/ 347
METRIC RANK
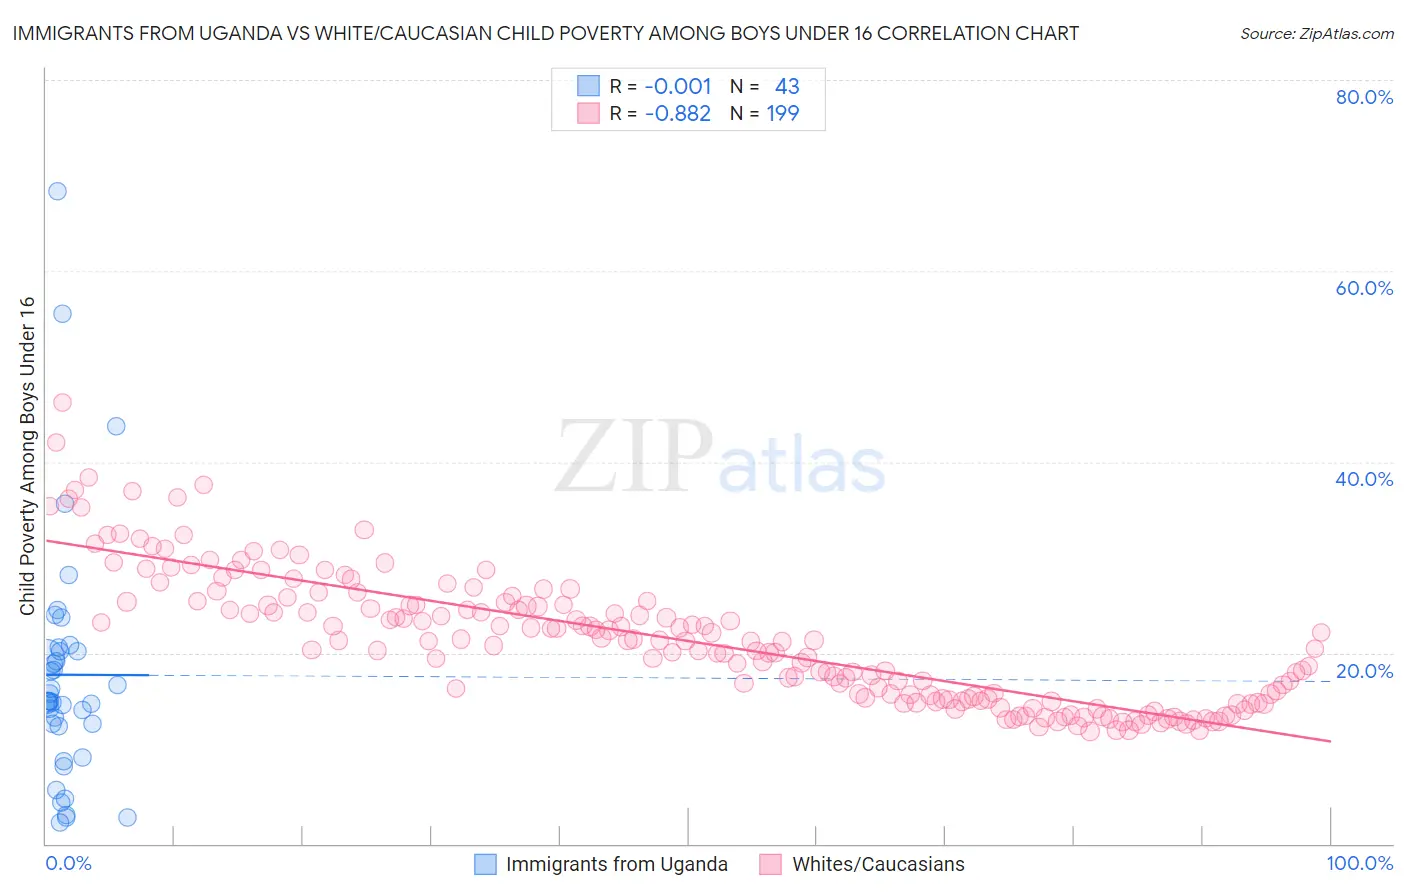
Immigrants from Uganda vs White/Caucasian Child Poverty Among Boys Under 16 Correlation Chart
The statistical analysis conducted on geographies consisting of 125,436,562 people shows no correlation between the proportion of Immigrants from Uganda and poverty level among boys under the age of 16 in the United States with a correlation coefficient (R) of -0.001 and weighted average of 17.0%. Similarly, the statistical analysis conducted on geographies consisting of 560,435,427 people shows a very strong negative correlation between the proportion of Whites/Caucasians and poverty level among boys under the age of 16 in the United States with a correlation coefficient (R) of -0.882 and weighted average of 16.5%, a difference of 3.4%.
Child Poverty Among Boys Under 16 Correlation Summary
| Measurement | Immigrants from Uganda | White/Caucasian |
| Minimum | 2.2% | 11.8% |
| Maximum | 68.4% | 46.2% |
| Range | 66.2% | 34.4% |
| Mean | 17.7% | 21.3% |
| Median | 14.9% | 21.2% |
| Interquartile 25% (IQ1) | 12.3% | 15.1% |
| Interquartile 75% (IQ3) | 20.2% | 25.3% |
| Interquartile Range (IQR) | 7.9% | 10.2% |
| Standard Deviation (Sample) | 13.0% | 6.9% |
| Standard Deviation (Population) | 12.9% | 6.9% |
Demographics Similar to Immigrants from Uganda and Whites/Caucasians by Child Poverty Among Boys Under 16
In terms of child poverty among boys under 16, the demographic groups most similar to Immigrants from Uganda are Immigrants from Iraq (17.0%, a difference of 0.0%), Immigrants from Lebanon (17.0%, a difference of 0.060%), Alaska Native (16.8%, a difference of 1.2%), Arab (16.8%, a difference of 1.3%), and Immigrants from Morocco (16.7%, a difference of 1.8%). Similarly, the demographic groups most similar to Whites/Caucasians are Ethiopian (16.5%, a difference of 0.040%), Scotch-Irish (16.5%, a difference of 0.080%), Immigrants from Syria (16.5%, a difference of 0.090%), Hungarian (16.5%, a difference of 0.10%), and Uruguayan (16.4%, a difference of 0.20%).
| Demographics | Rating | Rank | Child Poverty Among Boys Under 16 |
| Uruguayans | 50.0 /100 | #174 | Average 16.4% |
| Immigrants | Syria | 49.0 /100 | #175 | Average 16.5% |
| Whites/Caucasians | 48.2 /100 | #176 | Average 16.5% |
| Ethiopians | 47.8 /100 | #177 | Average 16.5% |
| Scotch-Irish | 47.5 /100 | #178 | Average 16.5% |
| Hungarians | 47.3 /100 | #179 | Average 16.5% |
| Hawaiians | 45.5 /100 | #180 | Average 16.5% |
| South American Indians | 44.3 /100 | #181 | Average 16.5% |
| Lebanese | 43.3 /100 | #182 | Average 16.6% |
| Kenyans | 41.0 /100 | #183 | Average 16.6% |
| Celtics | 40.6 /100 | #184 | Average 16.6% |
| Immigrants | Western Asia | 40.4 /100 | #185 | Average 16.6% |
| Hmong | 38.4 /100 | #186 | Fair 16.6% |
| Immigrants | Costa Rica | 37.8 /100 | #187 | Fair 16.7% |
| Immigrants | South America | 37.7 /100 | #188 | Fair 16.7% |
| Immigrants | Morocco | 34.5 /100 | #189 | Fair 16.7% |
| Arabs | 31.1 /100 | #190 | Fair 16.8% |
| Alaska Natives | 29.8 /100 | #191 | Fair 16.8% |
| Immigrants | Uganda | 21.6 /100 | #192 | Fair 17.0% |
| Immigrants | Iraq | 21.6 /100 | #193 | Fair 17.0% |
| Immigrants | Lebanon | 21.2 /100 | #194 | Fair 17.0% |