Apache vs Immigrants from Lebanon Single Father Poverty
COMPARE
Apache
Immigrants from Lebanon
Single Father Poverty
Single Father Poverty Comparison
Apache
Immigrants from Lebanon
24.2%
SINGLE FATHER POVERTY
0.0/ 100
METRIC RATING
339th/ 347
METRIC RANK
17.9%
SINGLE FATHER POVERTY
0.0/ 100
METRIC RATING
285th/ 347
METRIC RANK
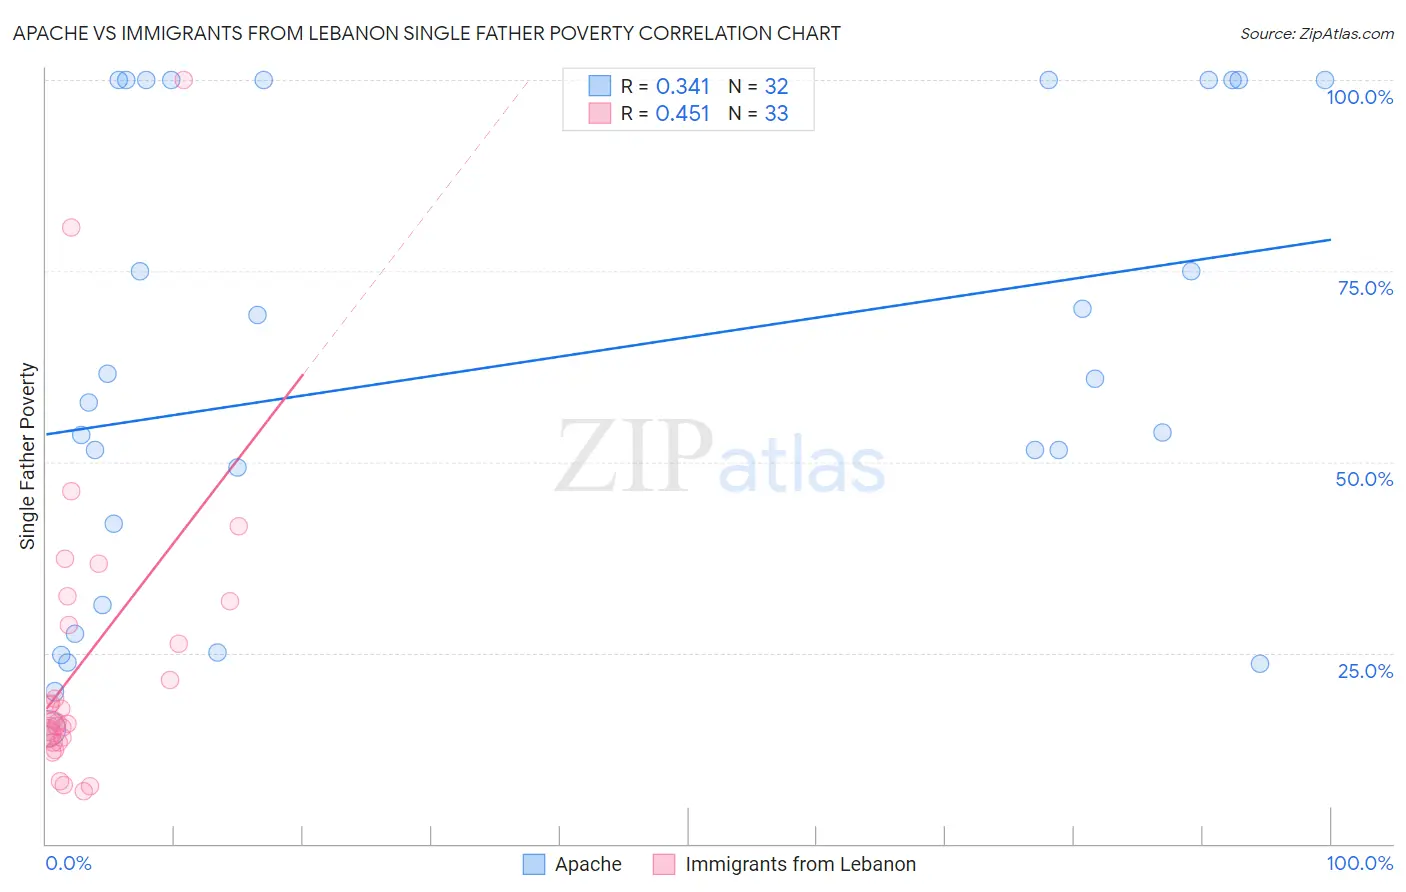
Apache vs Immigrants from Lebanon Single Father Poverty Correlation Chart
The statistical analysis conducted on geographies consisting of 199,792,986 people shows a mild positive correlation between the proportion of Apache and poverty level among single fathers in the United States with a correlation coefficient (R) of 0.341 and weighted average of 24.2%. Similarly, the statistical analysis conducted on geographies consisting of 180,091,576 people shows a moderate positive correlation between the proportion of Immigrants from Lebanon and poverty level among single fathers in the United States with a correlation coefficient (R) of 0.451 and weighted average of 17.9%, a difference of 35.5%.
Single Father Poverty Correlation Summary
| Measurement | Apache | Immigrants from Lebanon |
| Minimum | 15.1% | 6.9% |
| Maximum | 100.0% | 100.0% |
| Range | 84.9% | 93.1% |
| Mean | 62.9% | 23.9% |
| Median | 59.3% | 15.8% |
| Interquartile 25% (IQ1) | 36.6% | 13.6% |
| Interquartile 75% (IQ3) | 100.0% | 30.1% |
| Interquartile Range (IQR) | 63.4% | 16.5% |
| Standard Deviation (Sample) | 29.9% | 20.0% |
| Standard Deviation (Population) | 29.4% | 19.7% |
Similar Demographics by Single Father Poverty
Demographics Similar to Apache by Single Father Poverty
In terms of single father poverty, the demographic groups most similar to Apache are Arapaho (24.0%, a difference of 1.1%), Sioux (23.9%, a difference of 1.5%), Cajun (23.1%, a difference of 5.1%), Shoshone (22.9%, a difference of 5.8%), and Kiowa (22.5%, a difference of 7.9%).
| Demographics | Rating | Rank | Single Father Poverty |
| Tohono O'odham | 0.0 /100 | #332 | Tragic 22.0% |
| Natives/Alaskans | 0.0 /100 | #333 | Tragic 22.4% |
| Kiowa | 0.0 /100 | #334 | Tragic 22.5% |
| Shoshone | 0.0 /100 | #335 | Tragic 22.9% |
| Cajuns | 0.0 /100 | #336 | Tragic 23.1% |
| Sioux | 0.0 /100 | #337 | Tragic 23.9% |
| Arapaho | 0.0 /100 | #338 | Tragic 24.0% |
| Apache | 0.0 /100 | #339 | Tragic 24.2% |
| Houma | 0.0 /100 | #340 | Tragic 26.7% |
| Hopi | 0.0 /100 | #341 | Tragic 27.2% |
| Yuman | 0.0 /100 | #342 | Tragic 28.4% |
| Lumbee | 0.0 /100 | #343 | Tragic 28.5% |
| Navajo | 0.0 /100 | #344 | Tragic 29.2% |
| Crow | 0.0 /100 | #345 | Tragic 30.3% |
| Puerto Ricans | 0.0 /100 | #346 | Tragic 31.5% |
Demographics Similar to Immigrants from Lebanon by Single Father Poverty
In terms of single father poverty, the demographic groups most similar to Immigrants from Lebanon are Immigrants from North Macedonia (17.9%, a difference of 0.18%), Welsh (17.8%, a difference of 0.37%), Alsatian (17.8%, a difference of 0.38%), Carpatho Rusyn (18.0%, a difference of 0.40%), and Bahamian (18.0%, a difference of 0.42%).
| Demographics | Rating | Rank | Single Father Poverty |
| Germans | 0.0 /100 | #278 | Tragic 17.7% |
| Iroquois | 0.0 /100 | #279 | Tragic 17.7% |
| Scottish | 0.0 /100 | #280 | Tragic 17.7% |
| English | 0.0 /100 | #281 | Tragic 17.8% |
| Dutch | 0.0 /100 | #282 | Tragic 17.8% |
| Alsatians | 0.0 /100 | #283 | Tragic 17.8% |
| Welsh | 0.0 /100 | #284 | Tragic 17.8% |
| Immigrants | Lebanon | 0.0 /100 | #285 | Tragic 17.9% |
| Immigrants | North Macedonia | 0.0 /100 | #286 | Tragic 17.9% |
| Carpatho Rusyns | 0.0 /100 | #287 | Tragic 18.0% |
| Bahamians | 0.0 /100 | #288 | Tragic 18.0% |
| Irish | 0.0 /100 | #289 | Tragic 18.0% |
| West Indians | 0.0 /100 | #290 | Tragic 18.0% |
| Alaskan Athabascans | 0.0 /100 | #291 | Tragic 18.1% |
| Immigrants | Bahamas | 0.0 /100 | #292 | Tragic 18.1% |