Bermudan vs Immigrants from Lebanon Single Father Poverty
COMPARE
Bermudan
Immigrants from Lebanon
Single Father Poverty
Single Father Poverty Comparison
Bermudans
Immigrants from Lebanon
16.9%
SINGLE FATHER POVERTY
2.6/ 100
METRIC RATING
239th/ 347
METRIC RANK
17.9%
SINGLE FATHER POVERTY
0.0/ 100
METRIC RATING
285th/ 347
METRIC RANK
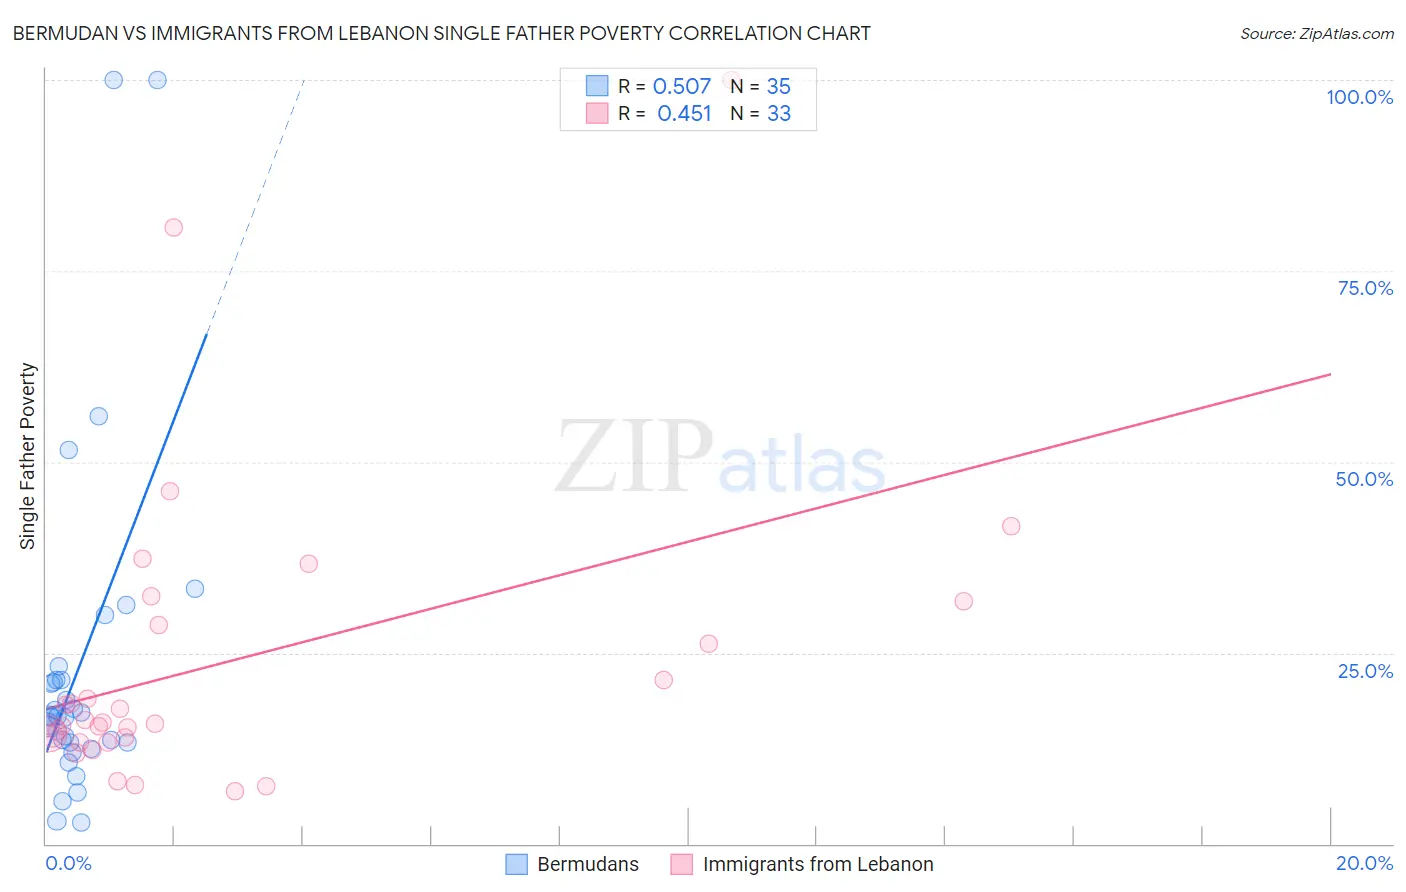
Bermudan vs Immigrants from Lebanon Single Father Poverty Correlation Chart
The statistical analysis conducted on geographies consisting of 52,766,587 people shows a substantial positive correlation between the proportion of Bermudans and poverty level among single fathers in the United States with a correlation coefficient (R) of 0.507 and weighted average of 16.9%. Similarly, the statistical analysis conducted on geographies consisting of 180,091,576 people shows a moderate positive correlation between the proportion of Immigrants from Lebanon and poverty level among single fathers in the United States with a correlation coefficient (R) of 0.451 and weighted average of 17.9%, a difference of 5.6%.
Single Father Poverty Correlation Summary
| Measurement | Bermudan | Immigrants from Lebanon |
| Minimum | 2.7% | 6.9% |
| Maximum | 100.0% | 100.0% |
| Range | 97.3% | 93.1% |
| Mean | 23.1% | 23.9% |
| Median | 16.7% | 15.8% |
| Interquartile 25% (IQ1) | 13.2% | 13.6% |
| Interquartile 75% (IQ3) | 21.5% | 30.1% |
| Interquartile Range (IQR) | 8.2% | 16.5% |
| Standard Deviation (Sample) | 22.2% | 20.0% |
| Standard Deviation (Population) | 21.9% | 19.7% |
Similar Demographics by Single Father Poverty
Demographics Similar to Bermudans by Single Father Poverty
In terms of single father poverty, the demographic groups most similar to Bermudans are Finnish (16.9%, a difference of 0.010%), Immigrants from Saudi Arabia (16.9%, a difference of 0.020%), Immigrants from Western Europe (16.9%, a difference of 0.090%), Immigrants from Germany (16.9%, a difference of 0.090%), and Subsaharan African (16.9%, a difference of 0.090%).
| Demographics | Rating | Rank | Single Father Poverty |
| Immigrants | Grenada | 3.7 /100 | #232 | Tragic 16.9% |
| Senegalese | 3.2 /100 | #233 | Tragic 16.9% |
| Marshallese | 3.1 /100 | #234 | Tragic 16.9% |
| Immigrants | Western Europe | 2.9 /100 | #235 | Tragic 16.9% |
| Immigrants | Germany | 2.9 /100 | #236 | Tragic 16.9% |
| Sub-Saharan Africans | 2.9 /100 | #237 | Tragic 16.9% |
| Immigrants | Saudi Arabia | 2.7 /100 | #238 | Tragic 16.9% |
| Bermudans | 2.6 /100 | #239 | Tragic 16.9% |
| Finns | 2.6 /100 | #240 | Tragic 16.9% |
| Czechs | 2.3 /100 | #241 | Tragic 17.0% |
| Moroccans | 2.1 /100 | #242 | Tragic 17.0% |
| Immigrants | Cabo Verde | 1.6 /100 | #243 | Tragic 17.0% |
| Hondurans | 1.6 /100 | #244 | Tragic 17.0% |
| Trinidadians and Tobagonians | 1.5 /100 | #245 | Tragic 17.0% |
| Immigrants | Ireland | 1.4 /100 | #246 | Tragic 17.1% |
Demographics Similar to Immigrants from Lebanon by Single Father Poverty
In terms of single father poverty, the demographic groups most similar to Immigrants from Lebanon are Immigrants from North Macedonia (17.9%, a difference of 0.18%), Welsh (17.8%, a difference of 0.37%), Alsatian (17.8%, a difference of 0.38%), Carpatho Rusyn (18.0%, a difference of 0.40%), and Bahamian (18.0%, a difference of 0.42%).
| Demographics | Rating | Rank | Single Father Poverty |
| Germans | 0.0 /100 | #278 | Tragic 17.7% |
| Iroquois | 0.0 /100 | #279 | Tragic 17.7% |
| Scottish | 0.0 /100 | #280 | Tragic 17.7% |
| English | 0.0 /100 | #281 | Tragic 17.8% |
| Dutch | 0.0 /100 | #282 | Tragic 17.8% |
| Alsatians | 0.0 /100 | #283 | Tragic 17.8% |
| Welsh | 0.0 /100 | #284 | Tragic 17.8% |
| Immigrants | Lebanon | 0.0 /100 | #285 | Tragic 17.9% |
| Immigrants | North Macedonia | 0.0 /100 | #286 | Tragic 17.9% |
| Carpatho Rusyns | 0.0 /100 | #287 | Tragic 18.0% |
| Bahamians | 0.0 /100 | #288 | Tragic 18.0% |
| Irish | 0.0 /100 | #289 | Tragic 18.0% |
| West Indians | 0.0 /100 | #290 | Tragic 18.0% |
| Alaskan Athabascans | 0.0 /100 | #291 | Tragic 18.1% |
| Immigrants | Bahamas | 0.0 /100 | #292 | Tragic 18.1% |