Apache vs Bolivian Single Father Poverty
COMPARE
Apache
Bolivian
Single Father Poverty
Single Father Poverty Comparison
Apache
Bolivians
24.2%
SINGLE FATHER POVERTY
0.0/ 100
METRIC RATING
339th/ 347
METRIC RANK
14.7%
SINGLE FATHER POVERTY
100.0/ 100
METRIC RATING
38th/ 347
METRIC RANK
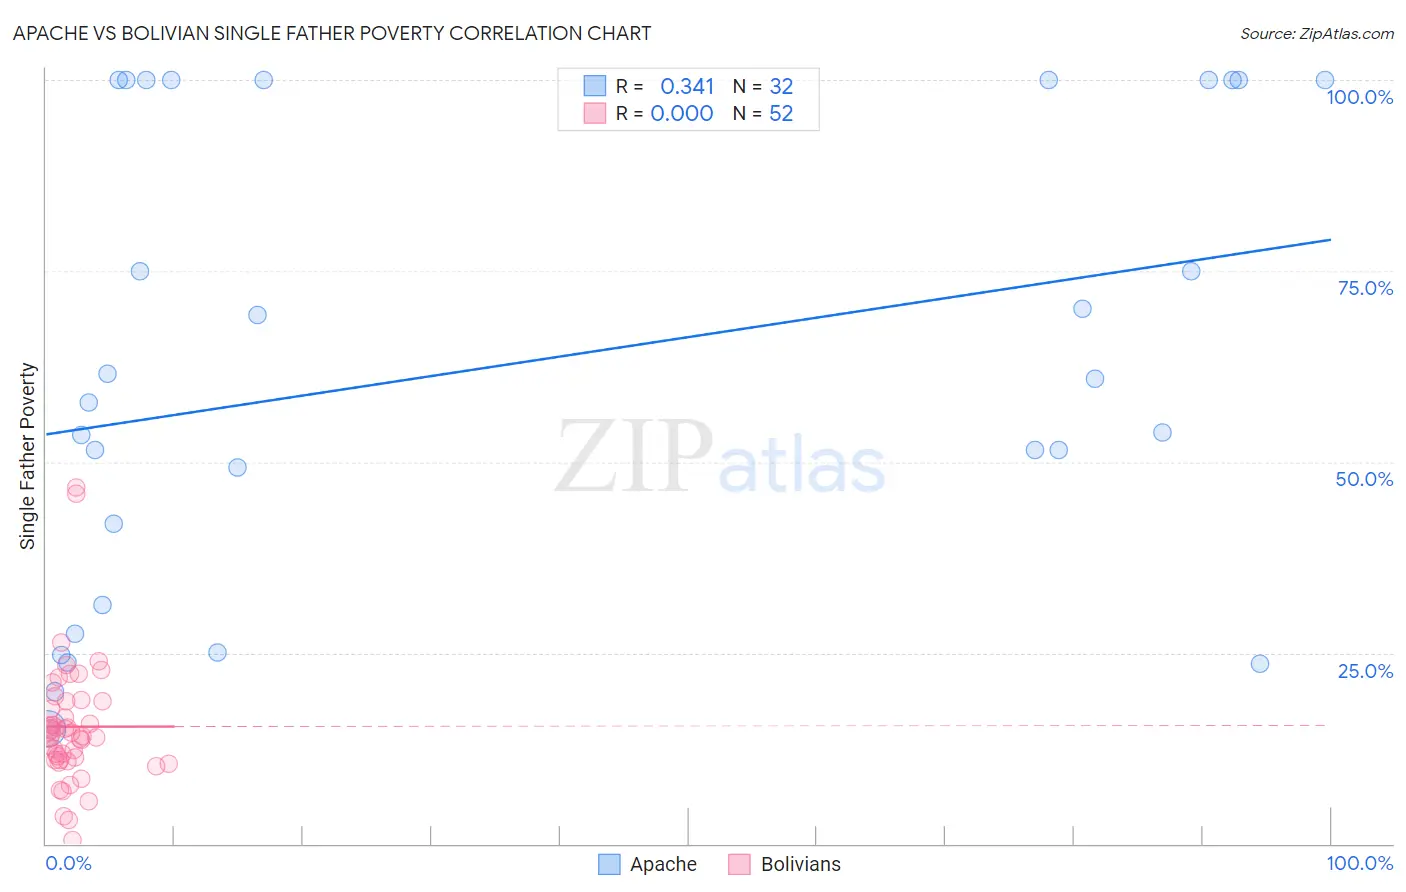
Apache vs Bolivian Single Father Poverty Correlation Chart
The statistical analysis conducted on geographies consisting of 199,792,986 people shows a mild positive correlation between the proportion of Apache and poverty level among single fathers in the United States with a correlation coefficient (R) of 0.341 and weighted average of 24.2%. Similarly, the statistical analysis conducted on geographies consisting of 157,877,648 people shows no correlation between the proportion of Bolivians and poverty level among single fathers in the United States with a correlation coefficient (R) of 0.000 and weighted average of 14.7%, a difference of 64.8%.
Single Father Poverty Correlation Summary
| Measurement | Apache | Bolivian |
| Minimum | 15.1% | 0.47% |
| Maximum | 100.0% | 46.7% |
| Range | 84.9% | 46.2% |
| Mean | 62.9% | 15.3% |
| Median | 59.3% | 14.3% |
| Interquartile 25% (IQ1) | 36.6% | 10.9% |
| Interquartile 75% (IQ3) | 100.0% | 18.6% |
| Interquartile Range (IQR) | 63.4% | 7.7% |
| Standard Deviation (Sample) | 29.9% | 8.3% |
| Standard Deviation (Population) | 29.4% | 8.2% |
Similar Demographics by Single Father Poverty
Demographics Similar to Apache by Single Father Poverty
In terms of single father poverty, the demographic groups most similar to Apache are Arapaho (24.0%, a difference of 1.1%), Sioux (23.9%, a difference of 1.5%), Cajun (23.1%, a difference of 5.1%), Shoshone (22.9%, a difference of 5.8%), and Kiowa (22.5%, a difference of 7.9%).
| Demographics | Rating | Rank | Single Father Poverty |
| Tohono O'odham | 0.0 /100 | #332 | Tragic 22.0% |
| Natives/Alaskans | 0.0 /100 | #333 | Tragic 22.4% |
| Kiowa | 0.0 /100 | #334 | Tragic 22.5% |
| Shoshone | 0.0 /100 | #335 | Tragic 22.9% |
| Cajuns | 0.0 /100 | #336 | Tragic 23.1% |
| Sioux | 0.0 /100 | #337 | Tragic 23.9% |
| Arapaho | 0.0 /100 | #338 | Tragic 24.0% |
| Apache | 0.0 /100 | #339 | Tragic 24.2% |
| Houma | 0.0 /100 | #340 | Tragic 26.7% |
| Hopi | 0.0 /100 | #341 | Tragic 27.2% |
| Yuman | 0.0 /100 | #342 | Tragic 28.4% |
| Lumbee | 0.0 /100 | #343 | Tragic 28.5% |
| Navajo | 0.0 /100 | #344 | Tragic 29.2% |
| Crow | 0.0 /100 | #345 | Tragic 30.3% |
| Puerto Ricans | 0.0 /100 | #346 | Tragic 31.5% |
Demographics Similar to Bolivians by Single Father Poverty
In terms of single father poverty, the demographic groups most similar to Bolivians are Immigrants from Eastern Africa (14.7%, a difference of 0.010%), Immigrants from Indonesia (14.7%, a difference of 0.14%), Immigrants from Asia (14.7%, a difference of 0.18%), Immigrants from Bolivia (14.7%, a difference of 0.30%), and Egyptian (14.7%, a difference of 0.37%).
| Demographics | Rating | Rank | Single Father Poverty |
| Icelanders | 100.0 /100 | #31 | Exceptional 14.5% |
| Asians | 100.0 /100 | #32 | Exceptional 14.6% |
| Okinawans | 100.0 /100 | #33 | Exceptional 14.6% |
| Egyptians | 100.0 /100 | #34 | Exceptional 14.7% |
| Immigrants | Bolivia | 100.0 /100 | #35 | Exceptional 14.7% |
| Immigrants | Indonesia | 100.0 /100 | #36 | Exceptional 14.7% |
| Immigrants | Eastern Africa | 100.0 /100 | #37 | Exceptional 14.7% |
| Bolivians | 100.0 /100 | #38 | Exceptional 14.7% |
| Immigrants | Asia | 100.0 /100 | #39 | Exceptional 14.7% |
| Pima | 100.0 /100 | #40 | Exceptional 14.8% |
| Indians (Asian) | 100.0 /100 | #41 | Exceptional 14.8% |
| Immigrants | Nepal | 100.0 /100 | #42 | Exceptional 14.8% |
| Immigrants | Eritrea | 100.0 /100 | #43 | Exceptional 14.8% |
| Salvadorans | 100.0 /100 | #44 | Exceptional 14.9% |
| Immigrants | Somalia | 100.0 /100 | #45 | Exceptional 14.9% |