Northern European vs Immigrants from Lebanon Single Father Poverty
COMPARE
Northern European
Immigrants from Lebanon
Single Father Poverty
Single Father Poverty Comparison
Northern Europeans
Immigrants from Lebanon
16.3%
SINGLE FATHER POVERTY
52.8/ 100
METRIC RATING
169th/ 347
METRIC RANK
17.9%
SINGLE FATHER POVERTY
0.0/ 100
METRIC RATING
285th/ 347
METRIC RANK
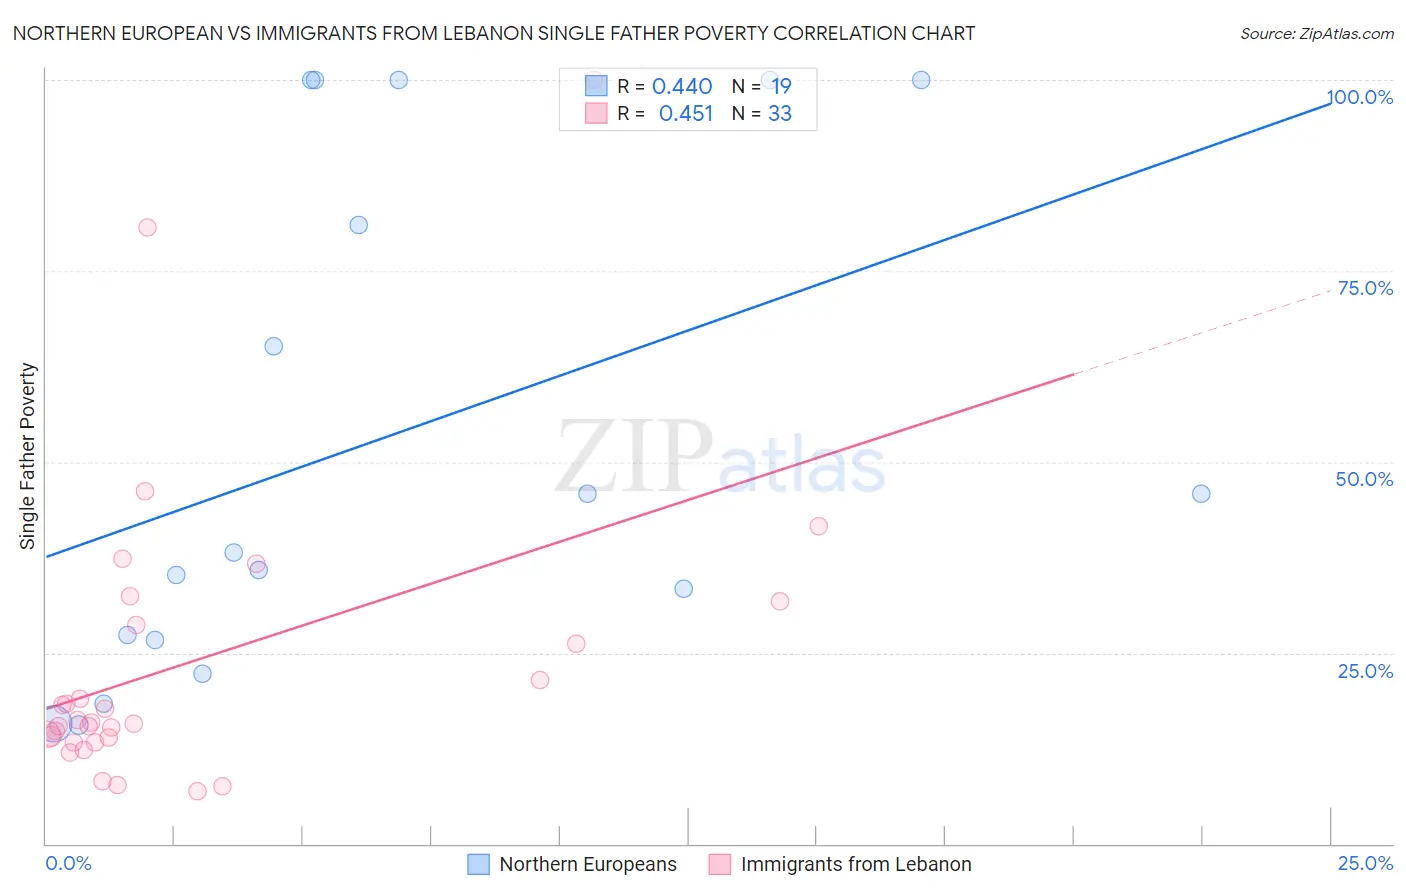
Northern European vs Immigrants from Lebanon Single Father Poverty Correlation Chart
The statistical analysis conducted on geographies consisting of 311,238,180 people shows a moderate positive correlation between the proportion of Northern Europeans and poverty level among single fathers in the United States with a correlation coefficient (R) of 0.440 and weighted average of 16.3%. Similarly, the statistical analysis conducted on geographies consisting of 180,091,576 people shows a moderate positive correlation between the proportion of Immigrants from Lebanon and poverty level among single fathers in the United States with a correlation coefficient (R) of 0.451 and weighted average of 17.9%, a difference of 9.9%.
Single Father Poverty Correlation Summary
| Measurement | Northern European | Immigrants from Lebanon |
| Minimum | 15.6% | 6.9% |
| Maximum | 100.0% | 100.0% |
| Range | 84.4% | 93.1% |
| Mean | 52.9% | 23.9% |
| Median | 38.1% | 15.8% |
| Interquartile 25% (IQ1) | 26.7% | 13.6% |
| Interquartile 75% (IQ3) | 100.0% | 30.1% |
| Interquartile Range (IQR) | 73.3% | 16.5% |
| Standard Deviation (Sample) | 33.0% | 20.0% |
| Standard Deviation (Population) | 32.1% | 19.7% |
Similar Demographics by Single Father Poverty
Demographics Similar to Northern Europeans by Single Father Poverty
In terms of single father poverty, the demographic groups most similar to Northern Europeans are Scandinavian (16.3%, a difference of 0.020%), Costa Rican (16.3%, a difference of 0.040%), Yugoslavian (16.3%, a difference of 0.050%), Immigrants from Europe (16.3%, a difference of 0.090%), and Immigrants from Morocco (16.3%, a difference of 0.090%).
| Demographics | Rating | Rank | Single Father Poverty |
| Ugandans | 55.9 /100 | #162 | Average 16.3% |
| Immigrants | Costa Rica | 55.7 /100 | #163 | Average 16.3% |
| Guyanese | 55.2 /100 | #164 | Average 16.3% |
| Immigrants | Bangladesh | 55.1 /100 | #165 | Average 16.3% |
| Immigrants | Europe | 54.8 /100 | #166 | Average 16.3% |
| Yugoslavians | 53.9 /100 | #167 | Average 16.3% |
| Costa Ricans | 53.6 /100 | #168 | Average 16.3% |
| Northern Europeans | 52.8 /100 | #169 | Average 16.3% |
| Scandinavians | 52.3 /100 | #170 | Average 16.3% |
| Immigrants | Morocco | 50.7 /100 | #171 | Average 16.3% |
| Immigrants | Sierra Leone | 50.1 /100 | #172 | Average 16.3% |
| Immigrants | St. Vincent and the Grenadines | 50.0 /100 | #173 | Average 16.3% |
| Swedes | 50.0 /100 | #174 | Average 16.3% |
| Immigrants | Ecuador | 49.7 /100 | #175 | Average 16.3% |
| Vietnamese | 48.0 /100 | #176 | Average 16.3% |
Demographics Similar to Immigrants from Lebanon by Single Father Poverty
In terms of single father poverty, the demographic groups most similar to Immigrants from Lebanon are Immigrants from North Macedonia (17.9%, a difference of 0.18%), Welsh (17.8%, a difference of 0.37%), Alsatian (17.8%, a difference of 0.38%), Carpatho Rusyn (18.0%, a difference of 0.40%), and Bahamian (18.0%, a difference of 0.42%).
| Demographics | Rating | Rank | Single Father Poverty |
| Germans | 0.0 /100 | #278 | Tragic 17.7% |
| Iroquois | 0.0 /100 | #279 | Tragic 17.7% |
| Scottish | 0.0 /100 | #280 | Tragic 17.7% |
| English | 0.0 /100 | #281 | Tragic 17.8% |
| Dutch | 0.0 /100 | #282 | Tragic 17.8% |
| Alsatians | 0.0 /100 | #283 | Tragic 17.8% |
| Welsh | 0.0 /100 | #284 | Tragic 17.8% |
| Immigrants | Lebanon | 0.0 /100 | #285 | Tragic 17.9% |
| Immigrants | North Macedonia | 0.0 /100 | #286 | Tragic 17.9% |
| Carpatho Rusyns | 0.0 /100 | #287 | Tragic 18.0% |
| Bahamians | 0.0 /100 | #288 | Tragic 18.0% |
| Irish | 0.0 /100 | #289 | Tragic 18.0% |
| West Indians | 0.0 /100 | #290 | Tragic 18.0% |
| Alaskan Athabascans | 0.0 /100 | #291 | Tragic 18.1% |
| Immigrants | Bahamas | 0.0 /100 | #292 | Tragic 18.1% |