Apache vs Belgian Single Mother Poverty
COMPARE
Apache
Belgian
Single Mother Poverty
Single Mother Poverty Comparison
Apache
Belgians
36.6%
SINGLE MOTHER POVERTY
0.0/ 100
METRIC RATING
329th/ 347
METRIC RANK
29.7%
SINGLE MOTHER POVERTY
18.8/ 100
METRIC RATING
201st/ 347
METRIC RANK
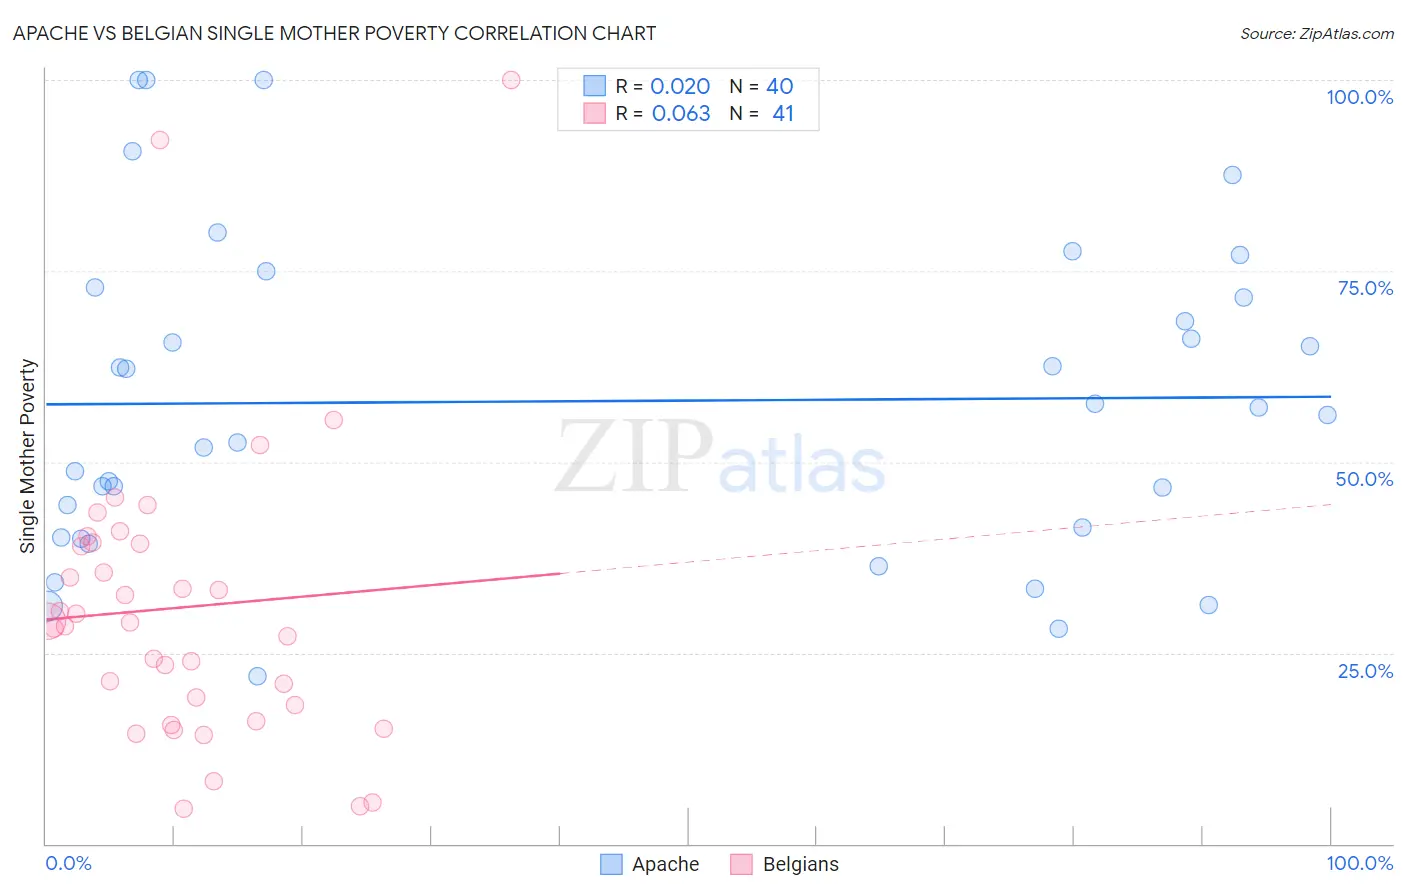
Apache vs Belgian Single Mother Poverty Correlation Chart
The statistical analysis conducted on geographies consisting of 229,112,849 people shows no correlation between the proportion of Apache and poverty level among single mothers in the United States with a correlation coefficient (R) of 0.020 and weighted average of 36.6%. Similarly, the statistical analysis conducted on geographies consisting of 346,546,144 people shows a slight positive correlation between the proportion of Belgians and poverty level among single mothers in the United States with a correlation coefficient (R) of 0.063 and weighted average of 29.7%, a difference of 23.3%.
Single Mother Poverty Correlation Summary
| Measurement | Apache | Belgian |
| Minimum | 21.9% | 4.5% |
| Maximum | 100.0% | 100.0% |
| Range | 78.1% | 95.5% |
| Mean | 57.9% | 30.9% |
| Median | 56.6% | 29.0% |
| Interquartile 25% (IQ1) | 40.8% | 17.1% |
| Interquartile 75% (IQ3) | 72.2% | 39.4% |
| Interquartile Range (IQR) | 31.4% | 22.2% |
| Standard Deviation (Sample) | 20.8% | 19.6% |
| Standard Deviation (Population) | 20.5% | 19.3% |
Similar Demographics by Single Mother Poverty
Demographics Similar to Apache by Single Mother Poverty
In terms of single mother poverty, the demographic groups most similar to Apache are Native/Alaskan (36.6%, a difference of 0.10%), Creek (36.7%, a difference of 0.26%), Choctaw (36.4%, a difference of 0.48%), Dutch West Indian (36.8%, a difference of 0.50%), and Yakama (36.4%, a difference of 0.53%).
| Demographics | Rating | Rank | Single Mother Poverty |
| Blacks/African Americans | 0.0 /100 | #322 | Tragic 35.2% |
| Kiowa | 0.0 /100 | #323 | Tragic 35.5% |
| Ottawa | 0.0 /100 | #324 | Tragic 35.5% |
| Ute | 0.0 /100 | #325 | Tragic 35.7% |
| Seminole | 0.0 /100 | #326 | Tragic 35.8% |
| Yakama | 0.0 /100 | #327 | Tragic 36.4% |
| Choctaw | 0.0 /100 | #328 | Tragic 36.4% |
| Apache | 0.0 /100 | #329 | Tragic 36.6% |
| Natives/Alaskans | 0.0 /100 | #330 | Tragic 36.6% |
| Creek | 0.0 /100 | #331 | Tragic 36.7% |
| Dutch West Indians | 0.0 /100 | #332 | Tragic 36.8% |
| Menominee | 0.0 /100 | #333 | Tragic 37.1% |
| Pueblo | 0.0 /100 | #334 | Tragic 37.2% |
| Yuman | 0.0 /100 | #335 | Tragic 37.8% |
| Cheyenne | 0.0 /100 | #336 | Tragic 38.5% |
Demographics Similar to Belgians by Single Mother Poverty
In terms of single mother poverty, the demographic groups most similar to Belgians are Panamanian (29.6%, a difference of 0.10%), Malaysian (29.7%, a difference of 0.10%), Swiss (29.7%, a difference of 0.12%), Cuban (29.6%, a difference of 0.15%), and Immigrants (29.7%, a difference of 0.18%).
| Demographics | Rating | Rank | Single Mother Poverty |
| Icelanders | 26.1 /100 | #194 | Fair 29.5% |
| Slavs | 24.5 /100 | #195 | Fair 29.6% |
| Spanish American Indians | 23.4 /100 | #196 | Fair 29.6% |
| Immigrants | Jamaica | 22.0 /100 | #197 | Fair 29.6% |
| Trinidadians and Tobagonians | 21.7 /100 | #198 | Fair 29.6% |
| Cubans | 20.8 /100 | #199 | Fair 29.6% |
| Panamanians | 20.0 /100 | #200 | Fair 29.6% |
| Belgians | 18.8 /100 | #201 | Poor 29.7% |
| Malaysians | 17.4 /100 | #202 | Poor 29.7% |
| Swiss | 17.2 /100 | #203 | Poor 29.7% |
| Immigrants | Immigrants | 16.6 /100 | #204 | Poor 29.7% |
| Czechoslovakians | 16.1 /100 | #205 | Poor 29.7% |
| Immigrants | Haiti | 15.8 /100 | #206 | Poor 29.7% |
| Immigrants | Panama | 15.5 /100 | #207 | Poor 29.8% |
| Immigrants | Guyana | 14.7 /100 | #208 | Poor 29.8% |