Apache vs French Single Mother Poverty
COMPARE
Apache
French
Single Mother Poverty
Single Mother Poverty Comparison
Apache
French
36.6%
SINGLE MOTHER POVERTY
0.0/ 100
METRIC RATING
329th/ 347
METRIC RANK
30.7%
SINGLE MOTHER POVERTY
1.3/ 100
METRIC RATING
244th/ 347
METRIC RANK
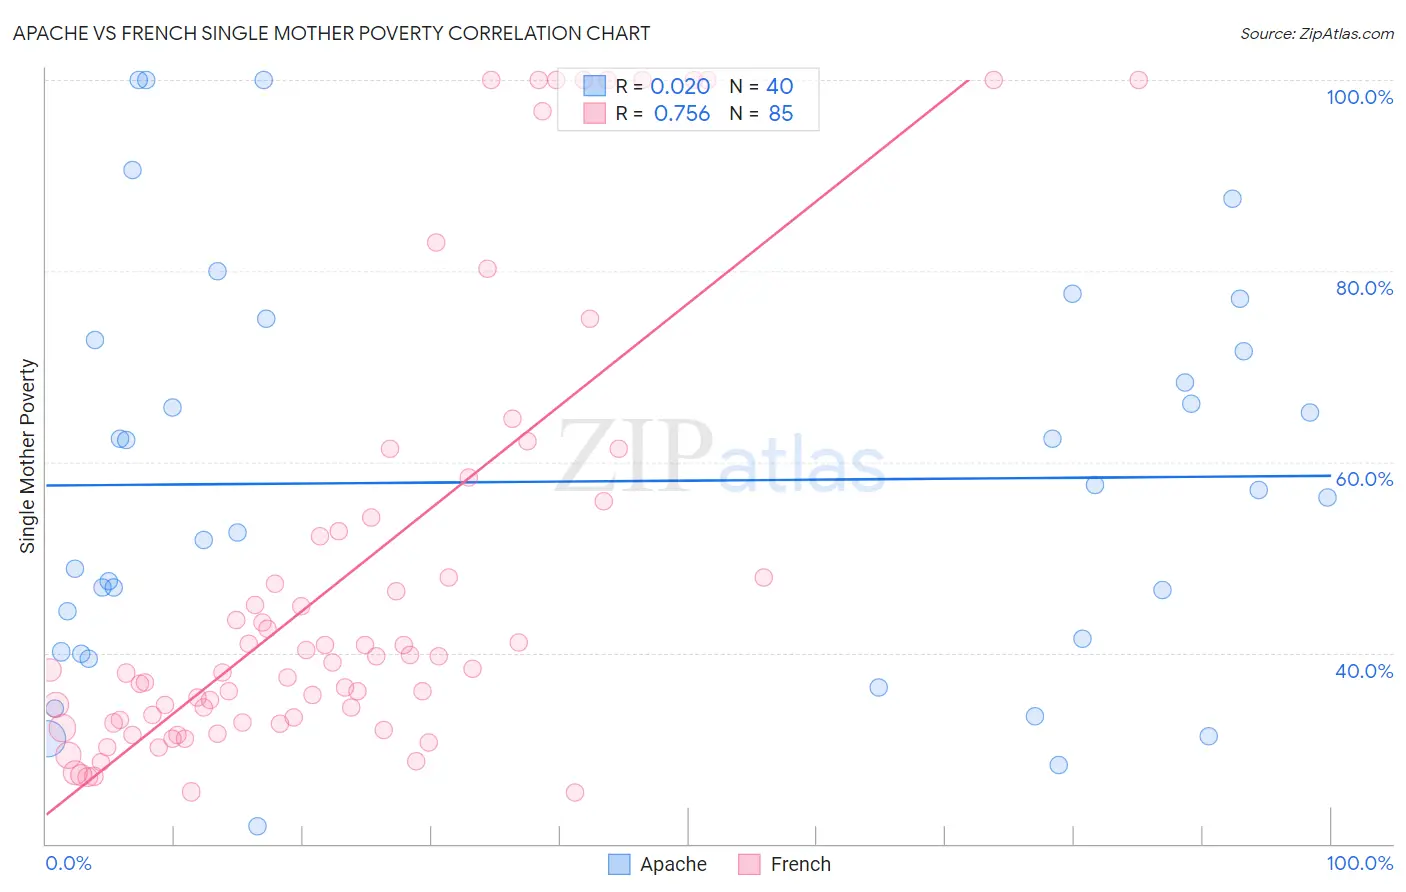
Apache vs French Single Mother Poverty Correlation Chart
The statistical analysis conducted on geographies consisting of 229,112,849 people shows no correlation between the proportion of Apache and poverty level among single mothers in the United States with a correlation coefficient (R) of 0.020 and weighted average of 36.6%. Similarly, the statistical analysis conducted on geographies consisting of 544,044,699 people shows a strong positive correlation between the proportion of French and poverty level among single mothers in the United States with a correlation coefficient (R) of 0.756 and weighted average of 30.7%, a difference of 19.3%.
Single Mother Poverty Correlation Summary
| Measurement | Apache | French |
| Minimum | 21.9% | 25.4% |
| Maximum | 100.0% | 100.0% |
| Range | 78.1% | 74.6% |
| Mean | 57.9% | 47.9% |
| Median | 56.6% | 38.3% |
| Interquartile 25% (IQ1) | 40.8% | 32.7% |
| Interquartile 75% (IQ3) | 72.2% | 53.4% |
| Interquartile Range (IQR) | 31.4% | 20.8% |
| Standard Deviation (Sample) | 20.8% | 23.1% |
| Standard Deviation (Population) | 20.5% | 23.0% |
Similar Demographics by Single Mother Poverty
Demographics Similar to Apache by Single Mother Poverty
In terms of single mother poverty, the demographic groups most similar to Apache are Native/Alaskan (36.6%, a difference of 0.10%), Creek (36.7%, a difference of 0.26%), Choctaw (36.4%, a difference of 0.48%), Dutch West Indian (36.8%, a difference of 0.50%), and Yakama (36.4%, a difference of 0.53%).
| Demographics | Rating | Rank | Single Mother Poverty |
| Blacks/African Americans | 0.0 /100 | #322 | Tragic 35.2% |
| Kiowa | 0.0 /100 | #323 | Tragic 35.5% |
| Ottawa | 0.0 /100 | #324 | Tragic 35.5% |
| Ute | 0.0 /100 | #325 | Tragic 35.7% |
| Seminole | 0.0 /100 | #326 | Tragic 35.8% |
| Yakama | 0.0 /100 | #327 | Tragic 36.4% |
| Choctaw | 0.0 /100 | #328 | Tragic 36.4% |
| Apache | 0.0 /100 | #329 | Tragic 36.6% |
| Natives/Alaskans | 0.0 /100 | #330 | Tragic 36.6% |
| Creek | 0.0 /100 | #331 | Tragic 36.7% |
| Dutch West Indians | 0.0 /100 | #332 | Tragic 36.8% |
| Menominee | 0.0 /100 | #333 | Tragic 37.1% |
| Pueblo | 0.0 /100 | #334 | Tragic 37.2% |
| Yuman | 0.0 /100 | #335 | Tragic 37.8% |
| Cheyenne | 0.0 /100 | #336 | Tragic 38.5% |
Demographics Similar to French by Single Mother Poverty
In terms of single mother poverty, the demographic groups most similar to French are Barbadian (30.7%, a difference of 0.010%), Bermudan (30.6%, a difference of 0.22%), Immigrants from Burma/Myanmar (30.6%, a difference of 0.30%), Immigrants from Laos (30.6%, a difference of 0.32%), and Salvadoran (30.6%, a difference of 0.37%).
| Demographics | Rating | Rank | Single Mother Poverty |
| Immigrants | St. Vincent and the Grenadines | 3.1 /100 | #237 | Tragic 30.4% |
| Slovaks | 2.8 /100 | #238 | Tragic 30.4% |
| Immigrants | Portugal | 2.1 /100 | #239 | Tragic 30.5% |
| Salvadorans | 1.8 /100 | #240 | Tragic 30.6% |
| Immigrants | Laos | 1.8 /100 | #241 | Tragic 30.6% |
| Immigrants | Burma/Myanmar | 1.7 /100 | #242 | Tragic 30.6% |
| Bermudans | 1.6 /100 | #243 | Tragic 30.6% |
| French | 1.3 /100 | #244 | Tragic 30.7% |
| Barbadians | 1.3 /100 | #245 | Tragic 30.7% |
| Ecuadorians | 0.9 /100 | #246 | Tragic 30.8% |
| West Indians | 0.9 /100 | #247 | Tragic 30.8% |
| French Canadians | 0.9 /100 | #248 | Tragic 30.8% |
| Cape Verdeans | 0.8 /100 | #249 | Tragic 30.8% |
| Vietnamese | 0.7 /100 | #250 | Tragic 30.9% |
| Tlingit-Haida | 0.6 /100 | #251 | Tragic 30.9% |