American vs Swiss Single Male Poverty
COMPARE
American
Swiss
Single Male Poverty
Single Male Poverty Comparison
Americans
Swiss
15.8%
SINGLE MALE POVERTY
0.0/ 100
METRIC RATING
309th/ 347
METRIC RANK
13.8%
SINGLE MALE POVERTY
0.3/ 100
METRIC RATING
260th/ 347
METRIC RANK
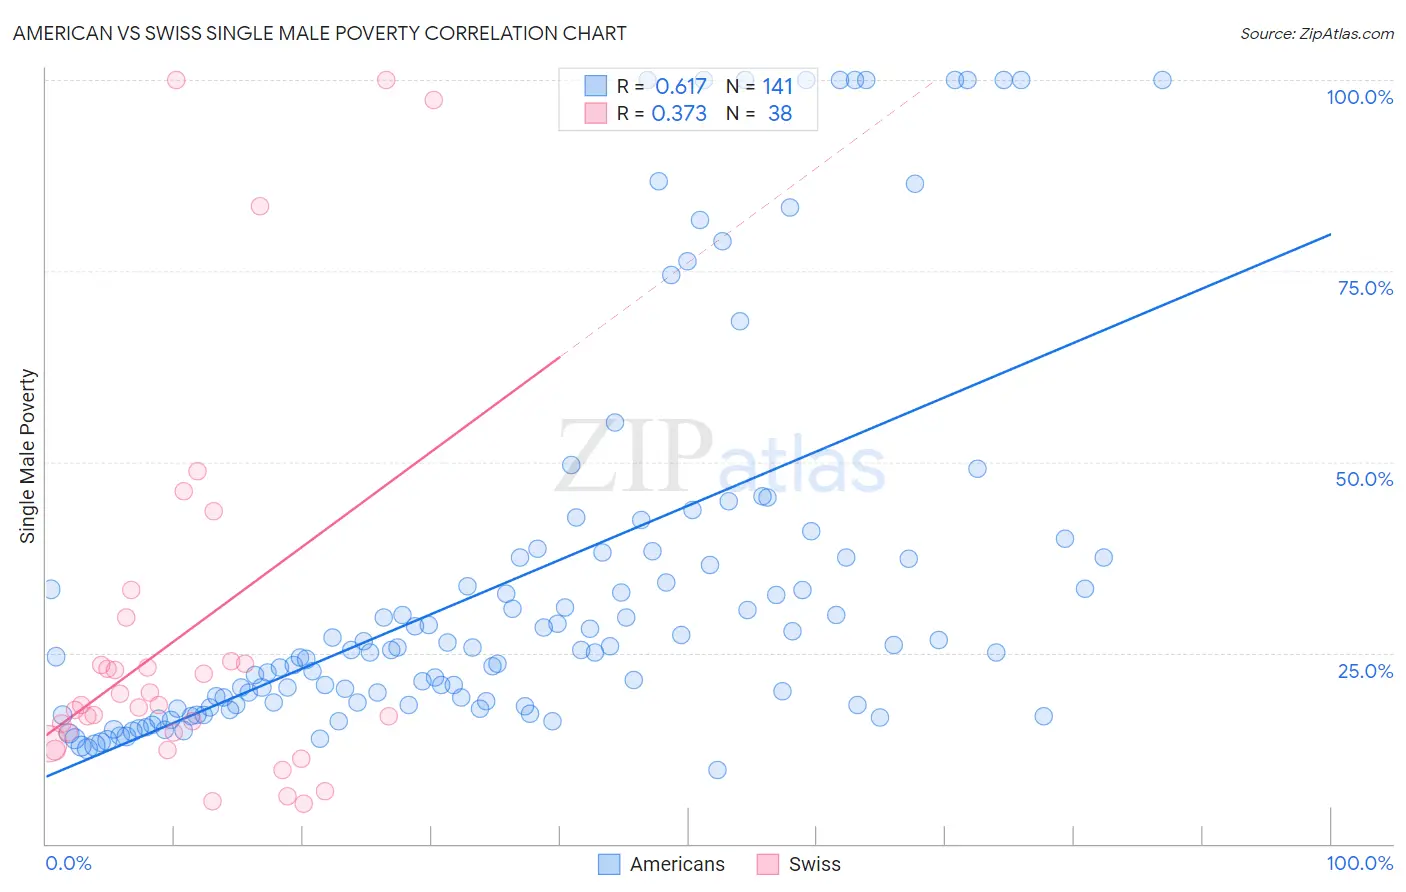
American vs Swiss Single Male Poverty Correlation Chart
The statistical analysis conducted on geographies consisting of 478,139,646 people shows a significant positive correlation between the proportion of Americans and poverty level among single males in the United States with a correlation coefficient (R) of 0.617 and weighted average of 15.8%. Similarly, the statistical analysis conducted on geographies consisting of 396,994,211 people shows a mild positive correlation between the proportion of Swiss and poverty level among single males in the United States with a correlation coefficient (R) of 0.373 and weighted average of 13.8%, a difference of 14.7%.
Single Male Poverty Correlation Summary
| Measurement | American | Swiss |
| Minimum | 9.7% | 5.3% |
| Maximum | 100.0% | 100.0% |
| Range | 90.3% | 94.7% |
| Mean | 34.5% | 27.6% |
| Median | 25.4% | 18.2% |
| Interquartile 25% (IQ1) | 18.2% | 14.5% |
| Interquartile 75% (IQ3) | 37.5% | 23.8% |
| Interquartile Range (IQR) | 19.3% | 9.3% |
| Standard Deviation (Sample) | 25.3% | 25.6% |
| Standard Deviation (Population) | 25.2% | 25.3% |
Similar Demographics by Single Male Poverty
Demographics Similar to Americans by Single Male Poverty
In terms of single male poverty, the demographic groups most similar to Americans are Potawatomi (15.8%, a difference of 0.17%), Ute (15.7%, a difference of 0.73%), Yakama (15.9%, a difference of 0.87%), Seminole (16.0%, a difference of 1.4%), and Comanche (16.0%, a difference of 1.4%).
| Demographics | Rating | Rank | Single Male Poverty |
| Alsatians | 0.0 /100 | #302 | Tragic 15.2% |
| Aleuts | 0.0 /100 | #303 | Tragic 15.4% |
| Alaska Natives | 0.0 /100 | #304 | Tragic 15.4% |
| Blackfeet | 0.0 /100 | #305 | Tragic 15.5% |
| Pennsylvania Germans | 0.0 /100 | #306 | Tragic 15.6% |
| Ute | 0.0 /100 | #307 | Tragic 15.7% |
| Potawatomi | 0.0 /100 | #308 | Tragic 15.8% |
| Americans | 0.0 /100 | #309 | Tragic 15.8% |
| Yakama | 0.0 /100 | #310 | Tragic 15.9% |
| Seminole | 0.0 /100 | #311 | Tragic 16.0% |
| Comanche | 0.0 /100 | #312 | Tragic 16.0% |
| Cherokee | 0.0 /100 | #313 | Tragic 16.1% |
| Alaskan Athabascans | 0.0 /100 | #314 | Tragic 16.1% |
| Cheyenne | 0.0 /100 | #315 | Tragic 16.1% |
| Dutch West Indians | 0.0 /100 | #316 | Tragic 16.1% |
Demographics Similar to Swiss by Single Male Poverty
In terms of single male poverty, the demographic groups most similar to Swiss are Hungarian (13.8%, a difference of 0.050%), Guatemalan (13.8%, a difference of 0.070%), Immigrants from Guatemala (13.8%, a difference of 0.11%), Immigrants from Central America (13.8%, a difference of 0.18%), and Fijian (13.8%, a difference of 0.22%).
| Demographics | Rating | Rank | Single Male Poverty |
| German Russians | 0.8 /100 | #253 | Tragic 13.6% |
| Sub-Saharan Africans | 0.5 /100 | #254 | Tragic 13.7% |
| Spaniards | 0.4 /100 | #255 | Tragic 13.7% |
| Immigrants | Belize | 0.4 /100 | #256 | Tragic 13.7% |
| Immigrants | Central America | 0.3 /100 | #257 | Tragic 13.8% |
| Immigrants | Guatemala | 0.3 /100 | #258 | Tragic 13.8% |
| Guatemalans | 0.3 /100 | #259 | Tragic 13.8% |
| Swiss | 0.3 /100 | #260 | Tragic 13.8% |
| Hungarians | 0.3 /100 | #261 | Tragic 13.8% |
| Fijians | 0.3 /100 | #262 | Tragic 13.8% |
| Cape Verdeans | 0.2 /100 | #263 | Tragic 13.8% |
| West Indians | 0.2 /100 | #264 | Tragic 13.8% |
| Immigrants | Congo | 0.2 /100 | #265 | Tragic 13.9% |
| Immigrants | Cabo Verde | 0.1 /100 | #266 | Tragic 13.9% |
| Germans | 0.1 /100 | #267 | Tragic 13.9% |