Immigrants from Moldova vs Swiss Single Male Poverty
COMPARE
Immigrants from Moldova
Swiss
Single Male Poverty
Single Male Poverty Comparison
Immigrants from Moldova
Swiss
11.2%
SINGLE MALE POVERTY
100.0/ 100
METRIC RATING
19th/ 347
METRIC RANK
13.8%
SINGLE MALE POVERTY
0.3/ 100
METRIC RATING
260th/ 347
METRIC RANK
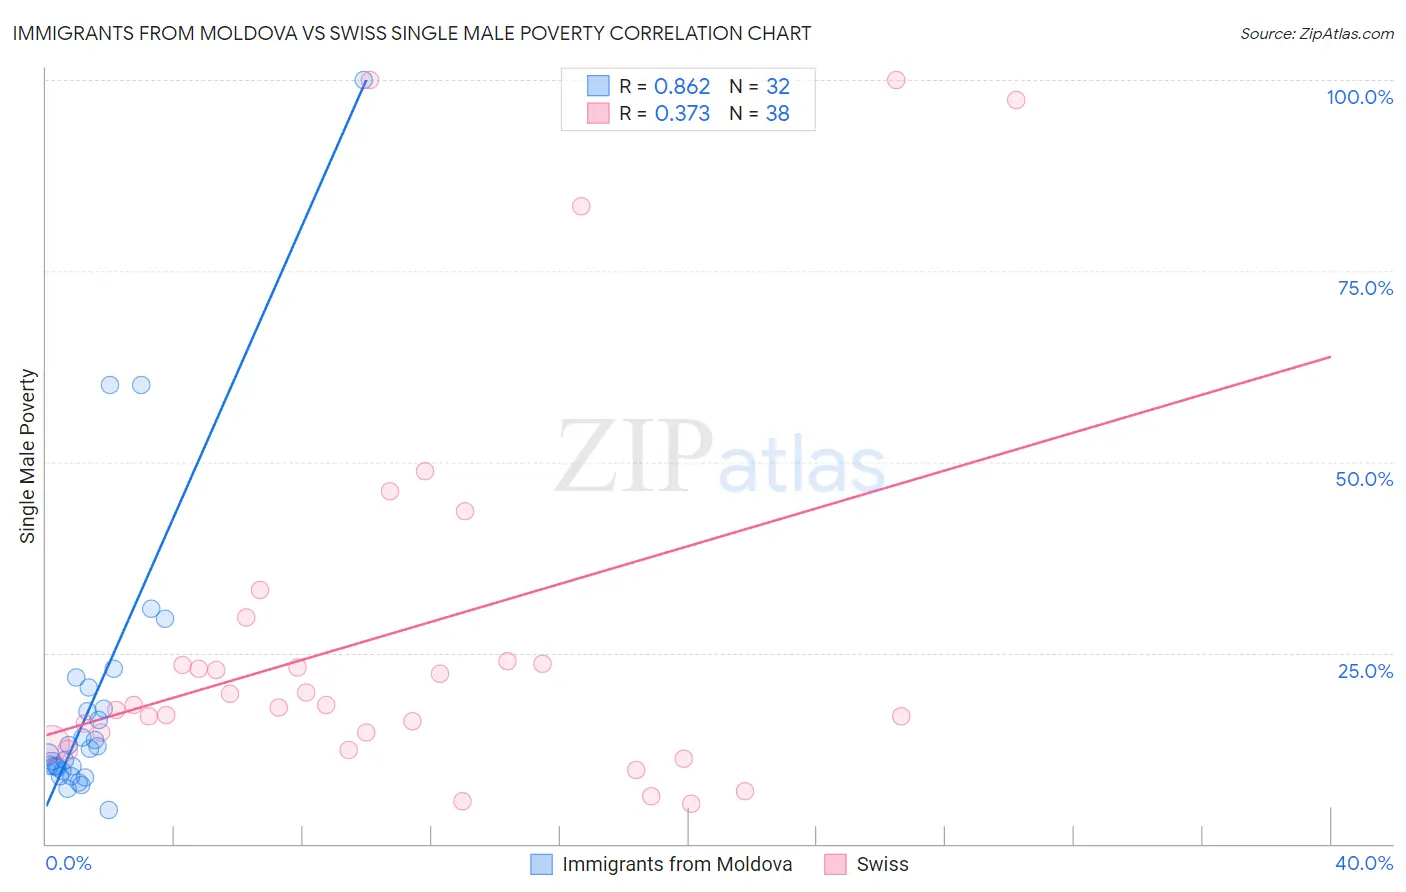
Immigrants from Moldova vs Swiss Single Male Poverty Correlation Chart
The statistical analysis conducted on geographies consisting of 116,791,948 people shows a very strong positive correlation between the proportion of Immigrants from Moldova and poverty level among single males in the United States with a correlation coefficient (R) of 0.862 and weighted average of 11.2%. Similarly, the statistical analysis conducted on geographies consisting of 396,994,211 people shows a mild positive correlation between the proportion of Swiss and poverty level among single males in the United States with a correlation coefficient (R) of 0.373 and weighted average of 13.8%, a difference of 23.4%.
Single Male Poverty Correlation Summary
| Measurement | Immigrants from Moldova | Swiss |
| Minimum | 4.3% | 5.3% |
| Maximum | 100.0% | 100.0% |
| Range | 95.7% | 94.7% |
| Mean | 19.0% | 27.6% |
| Median | 12.1% | 18.2% |
| Interquartile 25% (IQ1) | 9.7% | 14.5% |
| Interquartile 75% (IQ3) | 19.1% | 23.8% |
| Interquartile Range (IQR) | 9.4% | 9.3% |
| Standard Deviation (Sample) | 19.6% | 25.6% |
| Standard Deviation (Population) | 19.3% | 25.3% |
Similar Demographics by Single Male Poverty
Demographics Similar to Immigrants from Moldova by Single Male Poverty
In terms of single male poverty, the demographic groups most similar to Immigrants from Moldova are Ethiopian (11.2%, a difference of 0.020%), Asian (11.2%, a difference of 0.37%), Immigrants from Bolivia (11.1%, a difference of 0.38%), Immigrants from Pakistan (11.2%, a difference of 0.46%), and Bolivian (11.2%, a difference of 0.67%).
| Demographics | Rating | Rank | Single Male Poverty |
| Immigrants | Afghanistan | 100.0 /100 | #12 | Exceptional 10.9% |
| Immigrants | South Central Asia | 100.0 /100 | #13 | Exceptional 10.9% |
| Chinese | 100.0 /100 | #14 | Exceptional 11.0% |
| Koreans | 100.0 /100 | #15 | Exceptional 11.0% |
| Bhutanese | 100.0 /100 | #16 | Exceptional 11.1% |
| Tsimshian | 100.0 /100 | #17 | Exceptional 11.1% |
| Immigrants | Bolivia | 100.0 /100 | #18 | Exceptional 11.1% |
| Immigrants | Moldova | 100.0 /100 | #19 | Exceptional 11.2% |
| Ethiopians | 100.0 /100 | #20 | Exceptional 11.2% |
| Asians | 100.0 /100 | #21 | Exceptional 11.2% |
| Immigrants | Pakistan | 100.0 /100 | #22 | Exceptional 11.2% |
| Bolivians | 100.0 /100 | #23 | Exceptional 11.2% |
| Indians (Asian) | 100.0 /100 | #24 | Exceptional 11.3% |
| Maltese | 100.0 /100 | #25 | Exceptional 11.3% |
| Immigrants | Japan | 100.0 /100 | #26 | Exceptional 11.3% |
Demographics Similar to Swiss by Single Male Poverty
In terms of single male poverty, the demographic groups most similar to Swiss are Hungarian (13.8%, a difference of 0.050%), Guatemalan (13.8%, a difference of 0.070%), Immigrants from Guatemala (13.8%, a difference of 0.11%), Immigrants from Central America (13.8%, a difference of 0.18%), and Fijian (13.8%, a difference of 0.22%).
| Demographics | Rating | Rank | Single Male Poverty |
| German Russians | 0.8 /100 | #253 | Tragic 13.6% |
| Sub-Saharan Africans | 0.5 /100 | #254 | Tragic 13.7% |
| Spaniards | 0.4 /100 | #255 | Tragic 13.7% |
| Immigrants | Belize | 0.4 /100 | #256 | Tragic 13.7% |
| Immigrants | Central America | 0.3 /100 | #257 | Tragic 13.8% |
| Immigrants | Guatemala | 0.3 /100 | #258 | Tragic 13.8% |
| Guatemalans | 0.3 /100 | #259 | Tragic 13.8% |
| Swiss | 0.3 /100 | #260 | Tragic 13.8% |
| Hungarians | 0.3 /100 | #261 | Tragic 13.8% |
| Fijians | 0.3 /100 | #262 | Tragic 13.8% |
| Cape Verdeans | 0.2 /100 | #263 | Tragic 13.8% |
| West Indians | 0.2 /100 | #264 | Tragic 13.8% |
| Immigrants | Congo | 0.2 /100 | #265 | Tragic 13.9% |
| Immigrants | Cabo Verde | 0.1 /100 | #266 | Tragic 13.9% |
| Germans | 0.1 /100 | #267 | Tragic 13.9% |