American vs Nicaraguan Poverty
COMPARE
American
Nicaraguan
Poverty
Poverty Comparison
Americans
Nicaraguans
13.4%
POVERTY
2.9/ 100
METRIC RATING
220th/ 347
METRIC RANK
13.9%
POVERTY
0.4/ 100
METRIC RATING
239th/ 347
METRIC RANK
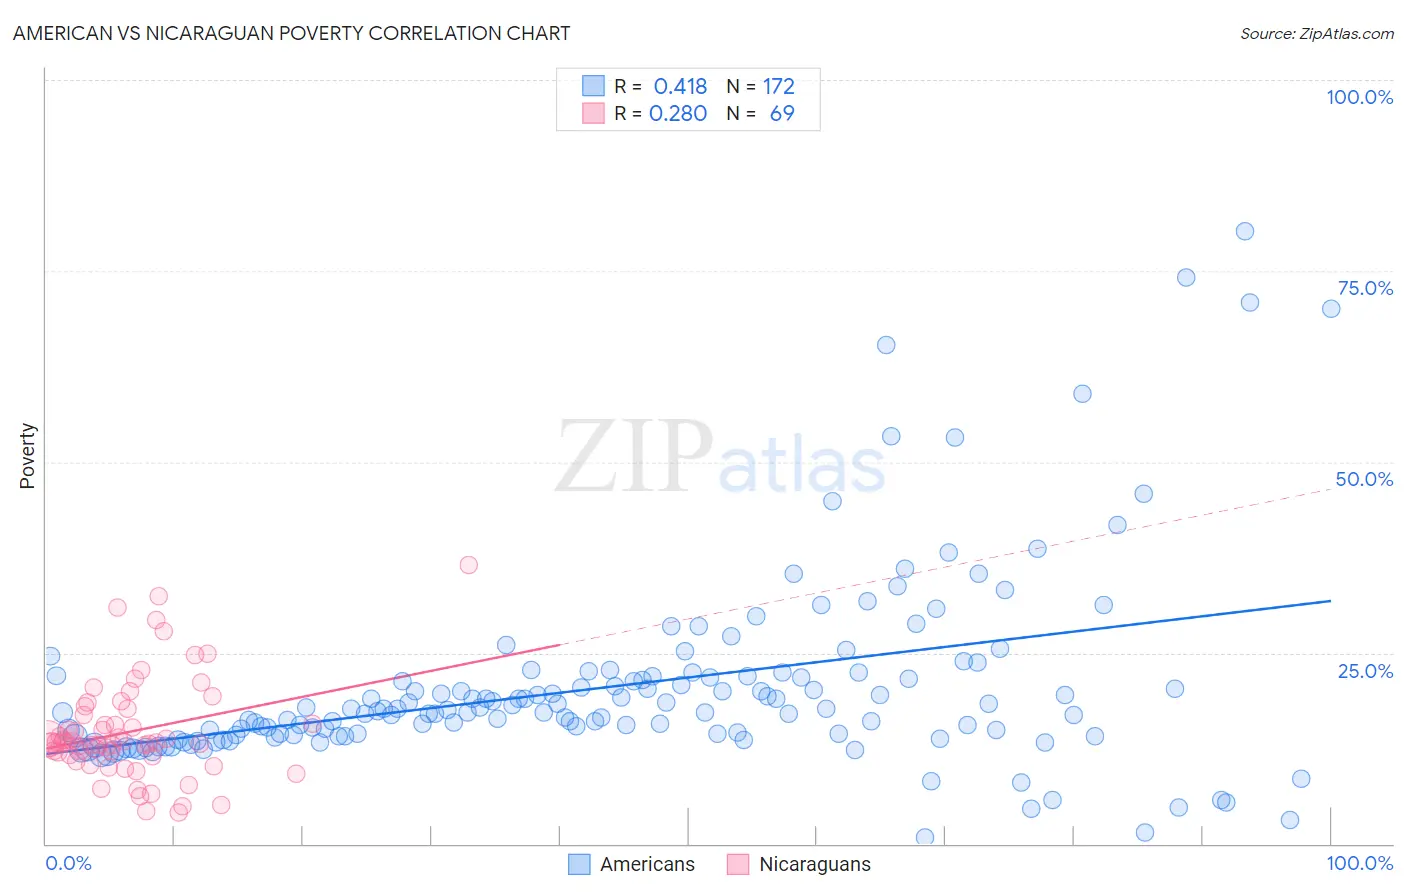
American vs Nicaraguan Poverty Correlation Chart
The statistical analysis conducted on geographies consisting of 580,977,330 people shows a moderate positive correlation between the proportion of Americans and poverty level in the United States with a correlation coefficient (R) of 0.418 and weighted average of 13.4%. Similarly, the statistical analysis conducted on geographies consisting of 285,615,173 people shows a weak positive correlation between the proportion of Nicaraguans and poverty level in the United States with a correlation coefficient (R) of 0.280 and weighted average of 13.9%, a difference of 4.3%.
Poverty Correlation Summary
| Measurement | American | Nicaraguan |
| Minimum | 0.85% | 4.2% |
| Maximum | 80.3% | 36.5% |
| Range | 79.4% | 32.4% |
| Mean | 20.5% | 14.7% |
| Median | 17.2% | 13.2% |
| Interquartile 25% (IQ1) | 14.1% | 11.5% |
| Interquartile 75% (IQ3) | 21.9% | 17.3% |
| Interquartile Range (IQR) | 7.8% | 5.8% |
| Standard Deviation (Sample) | 12.6% | 6.5% |
| Standard Deviation (Population) | 12.5% | 6.5% |
Demographics Similar to Americans and Nicaraguans by Poverty
In terms of poverty, the demographic groups most similar to Americans are Immigrants from Cambodia (13.4%, a difference of 0.090%), Alsatian (13.4%, a difference of 0.20%), Immigrants from Micronesia (13.4%, a difference of 0.24%), Immigrants from Africa (13.4%, a difference of 0.28%), and Immigrants from Eritrea (13.4%, a difference of 0.38%). Similarly, the demographic groups most similar to Nicaraguans are Ghanaian (13.9%, a difference of 0.35%), French American Indian (13.9%, a difference of 0.48%), Immigrants from Armenia (13.9%, a difference of 0.50%), Cuban (13.9%, a difference of 0.54%), and Immigrants from Laos (13.8%, a difference of 0.98%).
| Demographics | Rating | Rank | Poverty |
| Immigrants | Cambodia | 3.0 /100 | #219 | Tragic 13.4% |
| Americans | 2.9 /100 | #220 | Tragic 13.4% |
| Alsatians | 2.6 /100 | #221 | Tragic 13.4% |
| Immigrants | Micronesia | 2.6 /100 | #222 | Tragic 13.4% |
| Immigrants | Africa | 2.5 /100 | #223 | Tragic 13.4% |
| Immigrants | Eritrea | 2.4 /100 | #224 | Tragic 13.4% |
| German Russians | 2.2 /100 | #225 | Tragic 13.4% |
| Marshallese | 2.2 /100 | #226 | Tragic 13.4% |
| Alaska Natives | 2.1 /100 | #227 | Tragic 13.5% |
| Immigrants | Nigeria | 1.7 /100 | #228 | Tragic 13.5% |
| Osage | 1.5 /100 | #229 | Tragic 13.6% |
| Alaskan Athabascans | 1.5 /100 | #230 | Tragic 13.6% |
| Nigerians | 1.4 /100 | #231 | Tragic 13.6% |
| Fijians | 0.8 /100 | #232 | Tragic 13.7% |
| Immigrants | Saudi Arabia | 0.8 /100 | #233 | Tragic 13.8% |
| Immigrants | Laos | 0.7 /100 | #234 | Tragic 13.8% |
| Cubans | 0.6 /100 | #235 | Tragic 13.9% |
| Immigrants | Armenia | 0.5 /100 | #236 | Tragic 13.9% |
| French American Indians | 0.5 /100 | #237 | Tragic 13.9% |
| Ghanaians | 0.5 /100 | #238 | Tragic 13.9% |
| Nicaraguans | 0.4 /100 | #239 | Tragic 13.9% |