American vs Choctaw Male Poverty
COMPARE
American
Choctaw
Male Poverty
Male Poverty Comparison
Americans
Choctaw
12.1%
MALE POVERTY
3.2/ 100
METRIC RATING
212th/ 347
METRIC RANK
14.4%
MALE POVERTY
0.0/ 100
METRIC RATING
312th/ 347
METRIC RANK
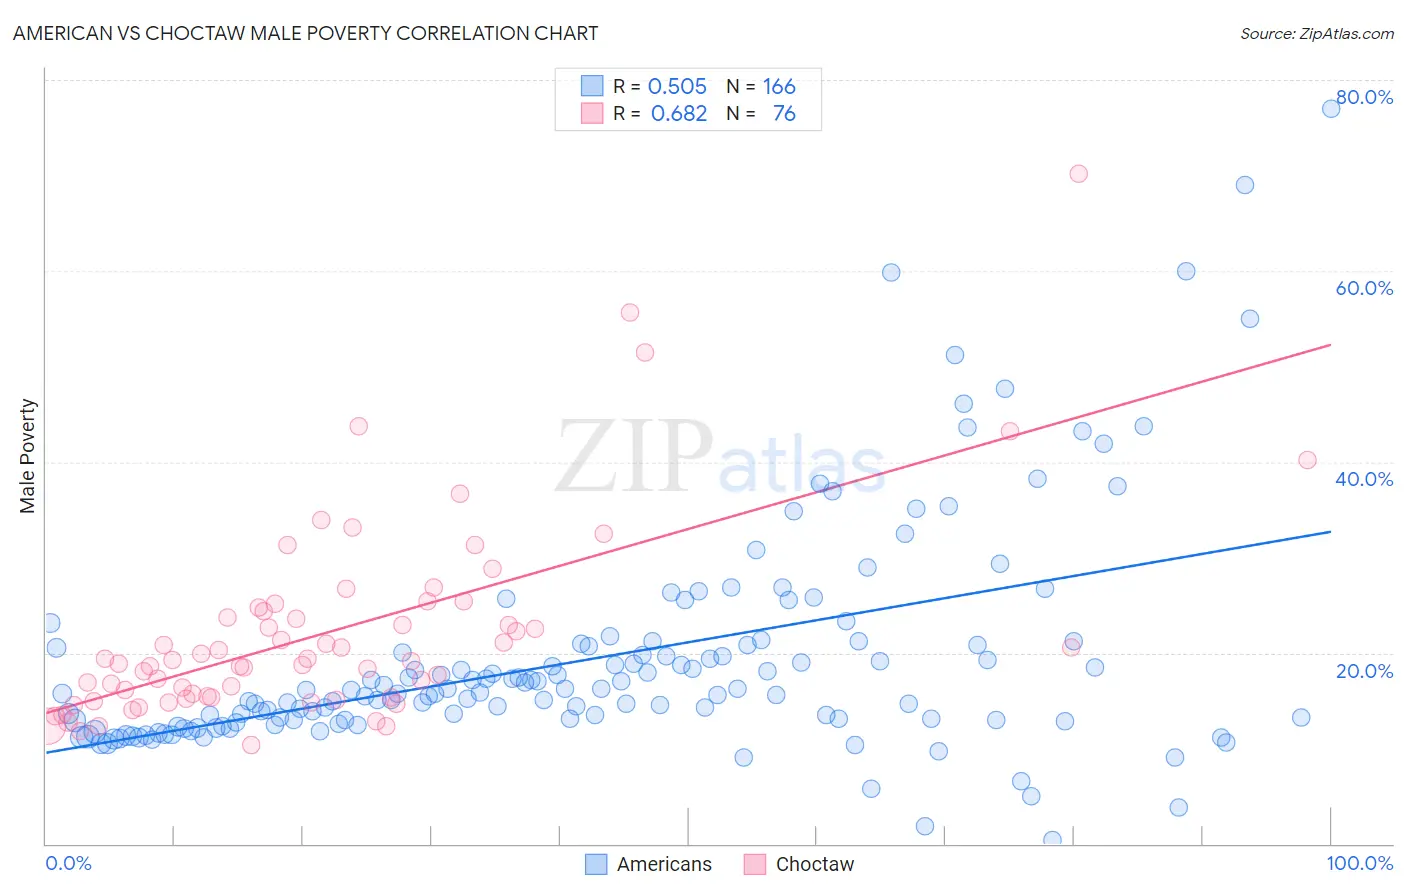
American vs Choctaw Male Poverty Correlation Chart
The statistical analysis conducted on geographies consisting of 579,982,816 people shows a substantial positive correlation between the proportion of Americans and poverty level among males in the United States with a correlation coefficient (R) of 0.505 and weighted average of 12.1%. Similarly, the statistical analysis conducted on geographies consisting of 269,566,788 people shows a significant positive correlation between the proportion of Choctaw and poverty level among males in the United States with a correlation coefficient (R) of 0.682 and weighted average of 14.4%, a difference of 18.7%.
Male Poverty Correlation Summary
| Measurement | American | Choctaw |
| Minimum | 0.36% | 10.4% |
| Maximum | 77.0% | 70.2% |
| Range | 76.7% | 59.8% |
| Mean | 19.4% | 22.2% |
| Median | 15.8% | 19.2% |
| Interquartile 25% (IQ1) | 12.9% | 15.3% |
| Interquartile 75% (IQ3) | 20.8% | 24.6% |
| Interquartile Range (IQR) | 7.9% | 9.3% |
| Standard Deviation (Sample) | 11.9% | 10.5% |
| Standard Deviation (Population) | 11.8% | 10.5% |
Similar Demographics by Male Poverty
Demographics Similar to Americans by Male Poverty
In terms of male poverty, the demographic groups most similar to Americans are Nonimmigrants (12.1%, a difference of 0.040%), Japanese (12.2%, a difference of 0.35%), Immigrants from Uzbekistan (12.2%, a difference of 0.47%), Immigrants from Cambodia (12.2%, a difference of 0.55%), and Immigrants from Panama (12.1%, a difference of 0.56%).
| Demographics | Rating | Rank | Male Poverty |
| Panamanians | 6.2 /100 | #205 | Tragic 11.9% |
| Immigrants | Eastern Africa | 5.4 /100 | #206 | Tragic 12.0% |
| Malaysians | 5.2 /100 | #207 | Tragic 12.0% |
| Immigrants | Immigrants | 4.5 /100 | #208 | Tragic 12.0% |
| Immigrants | Azores | 4.3 /100 | #209 | Tragic 12.0% |
| Moroccans | 4.2 /100 | #210 | Tragic 12.0% |
| Immigrants | Panama | 4.0 /100 | #211 | Tragic 12.1% |
| Americans | 3.2 /100 | #212 | Tragic 12.1% |
| Immigrants | Nonimmigrants | 3.1 /100 | #213 | Tragic 12.1% |
| Japanese | 2.7 /100 | #214 | Tragic 12.2% |
| Immigrants | Uzbekistan | 2.6 /100 | #215 | Tragic 12.2% |
| Immigrants | Cambodia | 2.5 /100 | #216 | Tragic 12.2% |
| Immigrants | Thailand | 2.5 /100 | #217 | Tragic 12.2% |
| German Russians | 2.5 /100 | #218 | Tragic 12.2% |
| Bermudans | 2.4 /100 | #219 | Tragic 12.2% |
Demographics Similar to Choctaw by Male Poverty
In terms of male poverty, the demographic groups most similar to Choctaw are Honduran (14.3%, a difference of 0.47%), Seminole (14.3%, a difference of 0.67%), Somali (14.3%, a difference of 0.88%), African (14.2%, a difference of 1.3%), and Dutch West Indian (14.2%, a difference of 1.3%).
| Demographics | Rating | Rank | Male Poverty |
| Immigrants | Bangladesh | 0.0 /100 | #305 | Tragic 14.1% |
| Creek | 0.0 /100 | #306 | Tragic 14.1% |
| Dutch West Indians | 0.0 /100 | #307 | Tragic 14.2% |
| Africans | 0.0 /100 | #308 | Tragic 14.2% |
| Somalis | 0.0 /100 | #309 | Tragic 14.3% |
| Seminole | 0.0 /100 | #310 | Tragic 14.3% |
| Hondurans | 0.0 /100 | #311 | Tragic 14.3% |
| Choctaw | 0.0 /100 | #312 | Tragic 14.4% |
| Immigrants | Somalia | 0.0 /100 | #313 | Tragic 14.6% |
| Immigrants | Honduras | 0.0 /100 | #314 | Tragic 14.6% |
| Chippewa | 0.0 /100 | #315 | Tragic 14.6% |
| British West Indians | 0.0 /100 | #316 | Tragic 14.6% |
| Immigrants | Dominica | 0.0 /100 | #317 | Tragic 14.7% |
| Immigrants | Grenada | 0.0 /100 | #318 | Tragic 14.7% |
| U.S. Virgin Islanders | 0.0 /100 | #319 | Tragic 14.7% |