American vs Ute Male Poverty
COMPARE
American
Ute
Male Poverty
Male Poverty Comparison
Americans
Ute
12.1%
MALE POVERTY
3.2/ 100
METRIC RATING
212th/ 347
METRIC RANK
16.2%
MALE POVERTY
0.0/ 100
METRIC RATING
331st/ 347
METRIC RANK
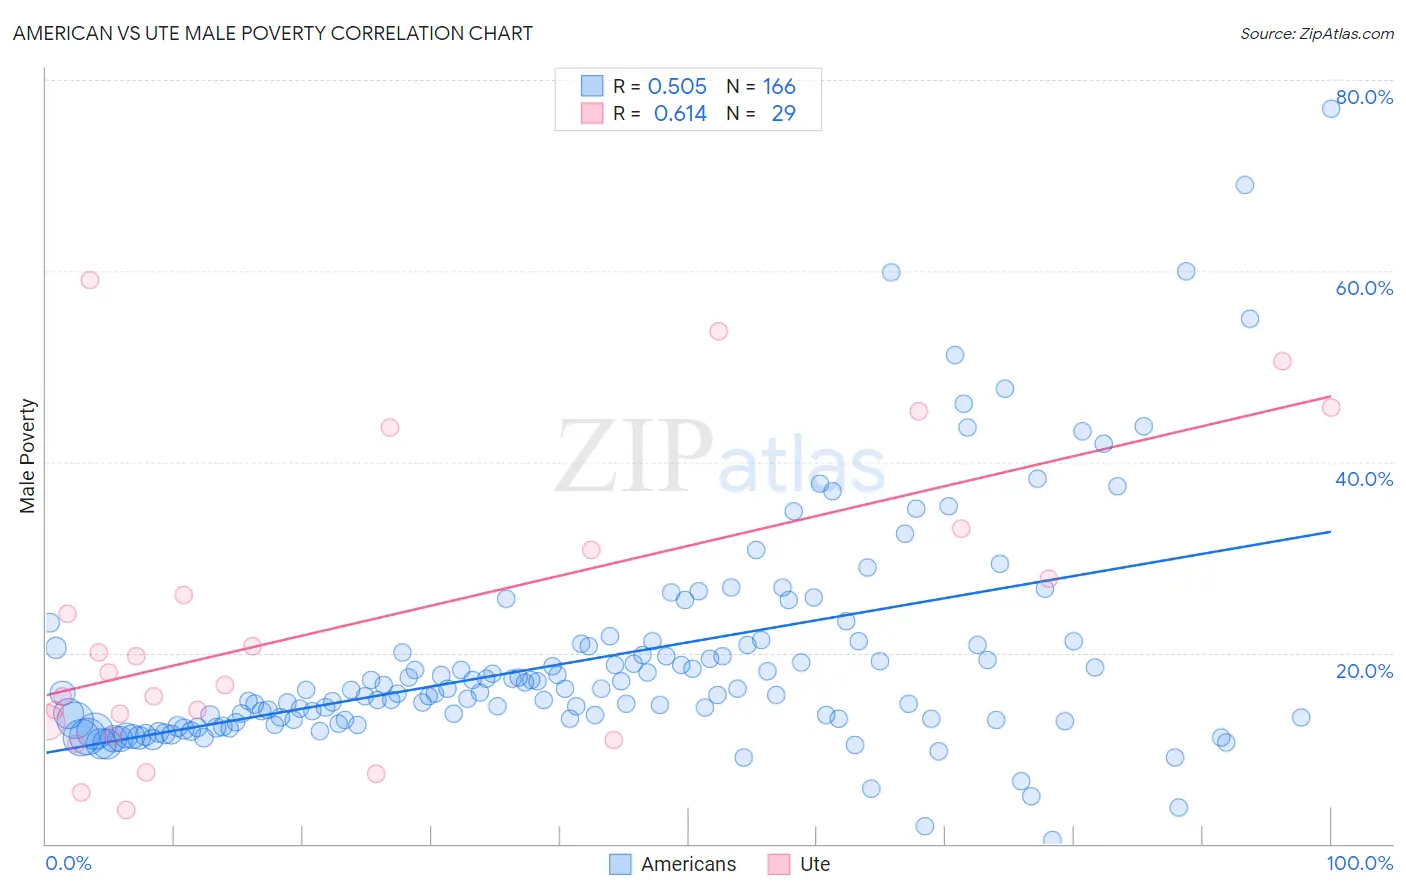
American vs Ute Male Poverty Correlation Chart
The statistical analysis conducted on geographies consisting of 579,982,816 people shows a substantial positive correlation between the proportion of Americans and poverty level among males in the United States with a correlation coefficient (R) of 0.505 and weighted average of 12.1%. Similarly, the statistical analysis conducted on geographies consisting of 55,650,694 people shows a significant positive correlation between the proportion of Ute and poverty level among males in the United States with a correlation coefficient (R) of 0.614 and weighted average of 16.2%, a difference of 33.9%.
Male Poverty Correlation Summary
| Measurement | American | Ute |
| Minimum | 0.36% | 3.5% |
| Maximum | 77.0% | 59.1% |
| Range | 76.7% | 55.6% |
| Mean | 19.4% | 23.3% |
| Median | 15.8% | 17.9% |
| Interquartile 25% (IQ1) | 12.9% | 12.0% |
| Interquartile 75% (IQ3) | 20.8% | 31.9% |
| Interquartile Range (IQR) | 7.9% | 20.0% |
| Standard Deviation (Sample) | 11.9% | 15.6% |
| Standard Deviation (Population) | 11.8% | 15.3% |
Similar Demographics by Male Poverty
Demographics Similar to Americans by Male Poverty
In terms of male poverty, the demographic groups most similar to Americans are Nonimmigrants (12.1%, a difference of 0.040%), Japanese (12.2%, a difference of 0.35%), Immigrants from Uzbekistan (12.2%, a difference of 0.47%), Immigrants from Cambodia (12.2%, a difference of 0.55%), and Immigrants from Panama (12.1%, a difference of 0.56%).
| Demographics | Rating | Rank | Male Poverty |
| Panamanians | 6.2 /100 | #205 | Tragic 11.9% |
| Immigrants | Eastern Africa | 5.4 /100 | #206 | Tragic 12.0% |
| Malaysians | 5.2 /100 | #207 | Tragic 12.0% |
| Immigrants | Immigrants | 4.5 /100 | #208 | Tragic 12.0% |
| Immigrants | Azores | 4.3 /100 | #209 | Tragic 12.0% |
| Moroccans | 4.2 /100 | #210 | Tragic 12.0% |
| Immigrants | Panama | 4.0 /100 | #211 | Tragic 12.1% |
| Americans | 3.2 /100 | #212 | Tragic 12.1% |
| Immigrants | Nonimmigrants | 3.1 /100 | #213 | Tragic 12.1% |
| Japanese | 2.7 /100 | #214 | Tragic 12.2% |
| Immigrants | Uzbekistan | 2.6 /100 | #215 | Tragic 12.2% |
| Immigrants | Cambodia | 2.5 /100 | #216 | Tragic 12.2% |
| Immigrants | Thailand | 2.5 /100 | #217 | Tragic 12.2% |
| German Russians | 2.5 /100 | #218 | Tragic 12.2% |
| Bermudans | 2.4 /100 | #219 | Tragic 12.2% |
Demographics Similar to Ute by Male Poverty
In terms of male poverty, the demographic groups most similar to Ute are Immigrants from Dominican Republic (16.2%, a difference of 0.34%), Dominican (16.1%, a difference of 0.99%), Black/African American (15.8%, a difference of 2.7%), Paiute (15.8%, a difference of 2.8%), and Houma (16.7%, a difference of 3.0%).
| Demographics | Rating | Rank | Male Poverty |
| Menominee | 0.0 /100 | #324 | Tragic 15.3% |
| Yakama | 0.0 /100 | #325 | Tragic 15.3% |
| Central American Indians | 0.0 /100 | #326 | Tragic 15.3% |
| Paiute | 0.0 /100 | #327 | Tragic 15.8% |
| Blacks/African Americans | 0.0 /100 | #328 | Tragic 15.8% |
| Dominicans | 0.0 /100 | #329 | Tragic 16.1% |
| Immigrants | Dominican Republic | 0.0 /100 | #330 | Tragic 16.2% |
| Ute | 0.0 /100 | #331 | Tragic 16.2% |
| Houma | 0.0 /100 | #332 | Tragic 16.7% |
| Natives/Alaskans | 0.0 /100 | #333 | Tragic 16.9% |
| Cheyenne | 0.0 /100 | #334 | Tragic 17.6% |
| Apache | 0.0 /100 | #335 | Tragic 17.7% |
| Pueblo | 0.0 /100 | #336 | Tragic 18.5% |
| Sioux | 0.0 /100 | #337 | Tragic 18.7% |
| Crow | 0.0 /100 | #338 | Tragic 19.1% |