Albanian vs Native Hawaiian Receiving Food Stamps
COMPARE
Albanian
Native Hawaiian
Receiving Food Stamps
Receiving Food Stamps Comparison
Albanians
Native Hawaiians
12.0%
RECEIVING FOOD STAMPS
35.4/ 100
METRIC RATING
187th/ 347
METRIC RANK
12.8%
RECEIVING FOOD STAMPS
6.7/ 100
METRIC RATING
215th/ 347
METRIC RANK
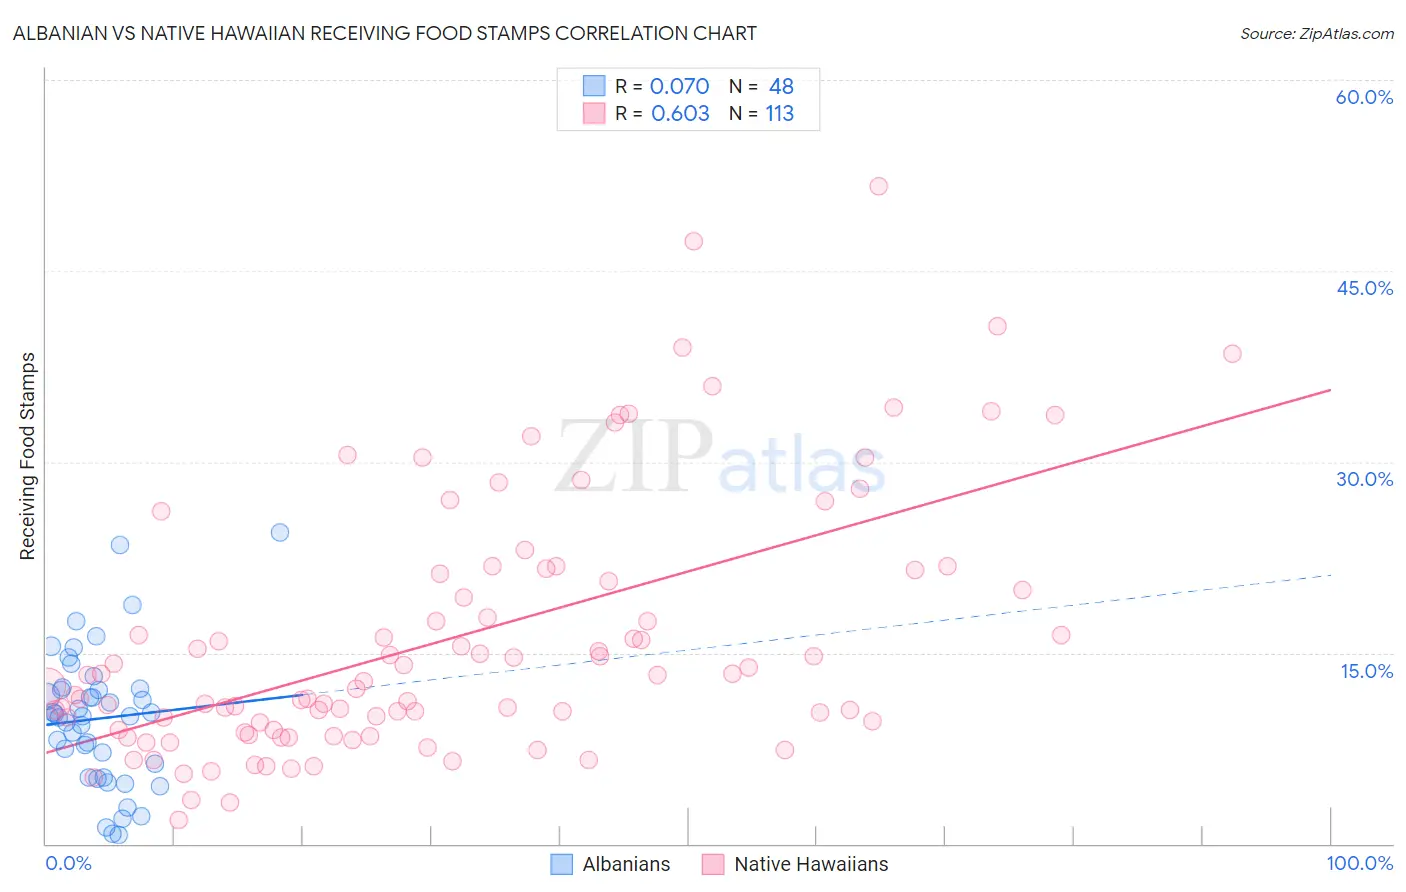
Albanian vs Native Hawaiian Receiving Food Stamps Correlation Chart
The statistical analysis conducted on geographies consisting of 192,875,347 people shows a slight positive correlation between the proportion of Albanians and percentage of population receiving government assistance and/or food stamps in the United States with a correlation coefficient (R) of 0.070 and weighted average of 12.0%. Similarly, the statistical analysis conducted on geographies consisting of 331,508,254 people shows a significant positive correlation between the proportion of Native Hawaiians and percentage of population receiving government assistance and/or food stamps in the United States with a correlation coefficient (R) of 0.603 and weighted average of 12.8%, a difference of 7.0%.
Receiving Food Stamps Correlation Summary
| Measurement | Albanian | Native Hawaiian |
| Minimum | 0.70% | 1.9% |
| Maximum | 24.5% | 51.7% |
| Range | 23.8% | 49.8% |
| Mean | 9.8% | 16.1% |
| Median | 10.0% | 12.8% |
| Interquartile 25% (IQ1) | 5.8% | 9.0% |
| Interquartile 75% (IQ3) | 12.2% | 21.4% |
| Interquartile Range (IQR) | 6.4% | 12.4% |
| Standard Deviation (Sample) | 5.3% | 10.1% |
| Standard Deviation (Population) | 5.2% | 10.1% |
Similar Demographics by Receiving Food Stamps
Demographics Similar to Albanians by Receiving Food Stamps
In terms of receiving food stamps, the demographic groups most similar to Albanians are Spanish (12.0%, a difference of 0.22%), Immigrants from Iraq (12.0%, a difference of 0.25%), Sudanese (12.0%, a difference of 0.31%), Immigrants from Cameroon (12.0%, a difference of 0.44%), and Immigrants from Peru (12.0%, a difference of 0.50%).
| Demographics | Rating | Rank | Receiving Food Stamps |
| Uruguayans | 44.8 /100 | #180 | Average 11.8% |
| South American Indians | 41.7 /100 | #181 | Average 11.9% |
| Immigrants | Morocco | 40.7 /100 | #182 | Average 11.9% |
| Immigrants | Uganda | 40.3 /100 | #183 | Average 11.9% |
| Spaniards | 39.8 /100 | #184 | Fair 11.9% |
| Immigrants | Iraq | 37.1 /100 | #185 | Fair 12.0% |
| Spanish | 36.9 /100 | #186 | Fair 12.0% |
| Albanians | 35.4 /100 | #187 | Fair 12.0% |
| Sudanese | 33.4 /100 | #188 | Fair 12.0% |
| Immigrants | Cameroon | 32.5 /100 | #189 | Fair 12.0% |
| Immigrants | Peru | 32.2 /100 | #190 | Fair 12.0% |
| Venezuelans | 32.1 /100 | #191 | Fair 12.0% |
| Samoans | 31.0 /100 | #192 | Fair 12.1% |
| Immigrants | Fiji | 27.8 /100 | #193 | Fair 12.1% |
| Immigrants | Sudan | 27.1 /100 | #194 | Fair 12.1% |
Demographics Similar to Native Hawaiians by Receiving Food Stamps
In terms of receiving food stamps, the demographic groups most similar to Native Hawaiians are Immigrants from South America (12.8%, a difference of 0.11%), Immigrants from Burma/Myanmar (12.9%, a difference of 0.36%), Immigrants from Africa (12.8%, a difference of 0.44%), Moroccan (12.8%, a difference of 0.47%), and Hawaiian (12.9%, a difference of 0.73%).
| Demographics | Rating | Rank | Receiving Food Stamps |
| Potawatomi | 14.6 /100 | #208 | Poor 12.5% |
| Immigrants | Sierra Leone | 12.9 /100 | #209 | Poor 12.5% |
| Immigrants | Uruguay | 12.8 /100 | #210 | Poor 12.5% |
| Colombians | 10.2 /100 | #211 | Poor 12.6% |
| Malaysians | 8.5 /100 | #212 | Tragic 12.7% |
| Moroccans | 7.6 /100 | #213 | Tragic 12.8% |
| Immigrants | Africa | 7.6 /100 | #214 | Tragic 12.8% |
| Native Hawaiians | 6.7 /100 | #215 | Tragic 12.8% |
| Immigrants | South America | 6.5 /100 | #216 | Tragic 12.8% |
| Immigrants | Burma/Myanmar | 6.0 /100 | #217 | Tragic 12.9% |
| Hawaiians | 5.4 /100 | #218 | Tragic 12.9% |
| Immigrants | Middle Africa | 5.4 /100 | #219 | Tragic 12.9% |
| Immigrants | Colombia | 5.3 /100 | #220 | Tragic 12.9% |
| Bermudans | 4.8 /100 | #221 | Tragic 13.0% |
| Immigrants | Immigrants | 4.4 /100 | #222 | Tragic 13.0% |