Albanian vs Native Hawaiian Cognitive Disability
COMPARE
Albanian
Native Hawaiian
Cognitive Disability
Cognitive Disability Comparison
Albanians
Native Hawaiians
16.8%
COGNITIVE DISABILITY
97.3/ 100
METRIC RATING
109th/ 347
METRIC RANK
16.7%
COGNITIVE DISABILITY
99.0/ 100
METRIC RATING
87th/ 347
METRIC RANK
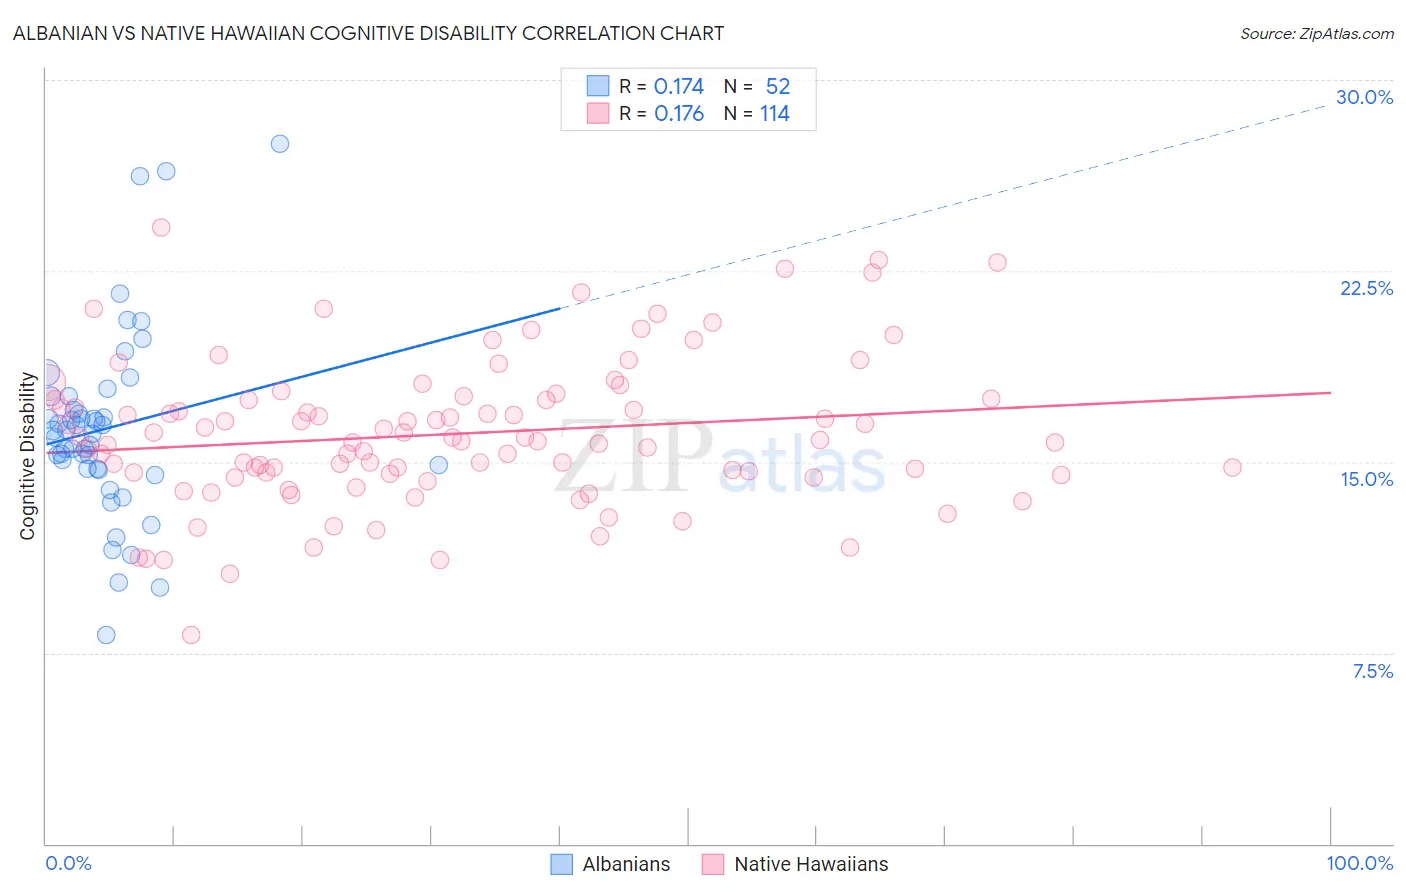
Albanian vs Native Hawaiian Cognitive Disability Correlation Chart
The statistical analysis conducted on geographies consisting of 193,265,298 people shows a poor positive correlation between the proportion of Albanians and percentage of population with cognitive disability in the United States with a correlation coefficient (R) of 0.174 and weighted average of 16.8%. Similarly, the statistical analysis conducted on geographies consisting of 332,041,393 people shows a poor positive correlation between the proportion of Native Hawaiians and percentage of population with cognitive disability in the United States with a correlation coefficient (R) of 0.176 and weighted average of 16.7%, a difference of 0.76%.
Cognitive Disability Correlation Summary
| Measurement | Albanian | Native Hawaiian |
| Minimum | 8.2% | 8.2% |
| Maximum | 27.5% | 24.2% |
| Range | 19.3% | 16.0% |
| Mean | 16.3% | 16.1% |
| Median | 16.2% | 15.8% |
| Interquartile 25% (IQ1) | 14.7% | 14.5% |
| Interquartile 75% (IQ3) | 17.3% | 17.5% |
| Interquartile Range (IQR) | 2.6% | 2.9% |
| Standard Deviation (Sample) | 3.7% | 2.9% |
| Standard Deviation (Population) | 3.6% | 2.9% |
Similar Demographics by Cognitive Disability
Demographics Similar to Albanians by Cognitive Disability
In terms of cognitive disability, the demographic groups most similar to Albanians are Arapaho (16.8%, a difference of 0.010%), Uruguayan (16.8%, a difference of 0.020%), Indian (Asian) (16.8%, a difference of 0.040%), Canadian (16.8%, a difference of 0.050%), and Immigrants from Sri Lanka (16.8%, a difference of 0.050%).
| Demographics | Rating | Rank | Cognitive Disability |
| Irish | 98.1 /100 | #102 | Exceptional 16.8% |
| Paraguayans | 98.0 /100 | #103 | Exceptional 16.8% |
| Palestinians | 98.0 /100 | #104 | Exceptional 16.8% |
| Immigrants | Eastern Asia | 97.9 /100 | #105 | Exceptional 16.8% |
| Northern Europeans | 97.8 /100 | #106 | Exceptional 16.8% |
| Immigrants | Nicaragua | 97.8 /100 | #107 | Exceptional 16.8% |
| Canadians | 97.5 /100 | #108 | Exceptional 16.8% |
| Albanians | 97.3 /100 | #109 | Exceptional 16.8% |
| Arapaho | 97.3 /100 | #110 | Exceptional 16.8% |
| Uruguayans | 97.2 /100 | #111 | Exceptional 16.8% |
| Indians (Asian) | 97.2 /100 | #112 | Exceptional 16.8% |
| Immigrants | Sri Lanka | 97.1 /100 | #113 | Exceptional 16.8% |
| Koreans | 97.1 /100 | #114 | Exceptional 16.8% |
| Yup'ik | 96.9 /100 | #115 | Exceptional 16.9% |
| Inupiat | 96.5 /100 | #116 | Exceptional 16.9% |
Demographics Similar to Native Hawaiians by Cognitive Disability
In terms of cognitive disability, the demographic groups most similar to Native Hawaiians are Immigrants from South Africa (16.7%, a difference of 0.010%), Immigrants from Moldova (16.7%, a difference of 0.050%), Belgian (16.7%, a difference of 0.060%), Immigrants from Philippines (16.7%, a difference of 0.060%), and Serbian (16.7%, a difference of 0.080%).
| Demographics | Rating | Rank | Cognitive Disability |
| Egyptians | 99.2 /100 | #80 | Exceptional 16.7% |
| Immigrants | Netherlands | 99.2 /100 | #81 | Exceptional 16.7% |
| Swiss | 99.2 /100 | #82 | Exceptional 16.7% |
| Serbians | 99.1 /100 | #83 | Exceptional 16.7% |
| Belgians | 99.1 /100 | #84 | Exceptional 16.7% |
| Immigrants | Moldova | 99.1 /100 | #85 | Exceptional 16.7% |
| Immigrants | South Africa | 99.0 /100 | #86 | Exceptional 16.7% |
| Native Hawaiians | 99.0 /100 | #87 | Exceptional 16.7% |
| Immigrants | Philippines | 99.0 /100 | #88 | Exceptional 16.7% |
| Immigrants | Egypt | 98.8 /100 | #89 | Exceptional 16.7% |
| South Americans | 98.8 /100 | #90 | Exceptional 16.7% |
| Danes | 98.8 /100 | #91 | Exceptional 16.7% |
| Immigrants | South America | 98.8 /100 | #92 | Exceptional 16.7% |
| Immigrants | Southern Europe | 98.7 /100 | #93 | Exceptional 16.7% |
| Asians | 98.7 /100 | #94 | Exceptional 16.7% |