Albanian vs Honduran Receiving Food Stamps
COMPARE
Albanian
Honduran
Receiving Food Stamps
Receiving Food Stamps Comparison
Albanians
Hondurans
12.0%
RECEIVING FOOD STAMPS
35.4/ 100
METRIC RATING
187th/ 347
METRIC RANK
15.5%
RECEIVING FOOD STAMPS
0.0/ 100
METRIC RATING
291st/ 347
METRIC RANK
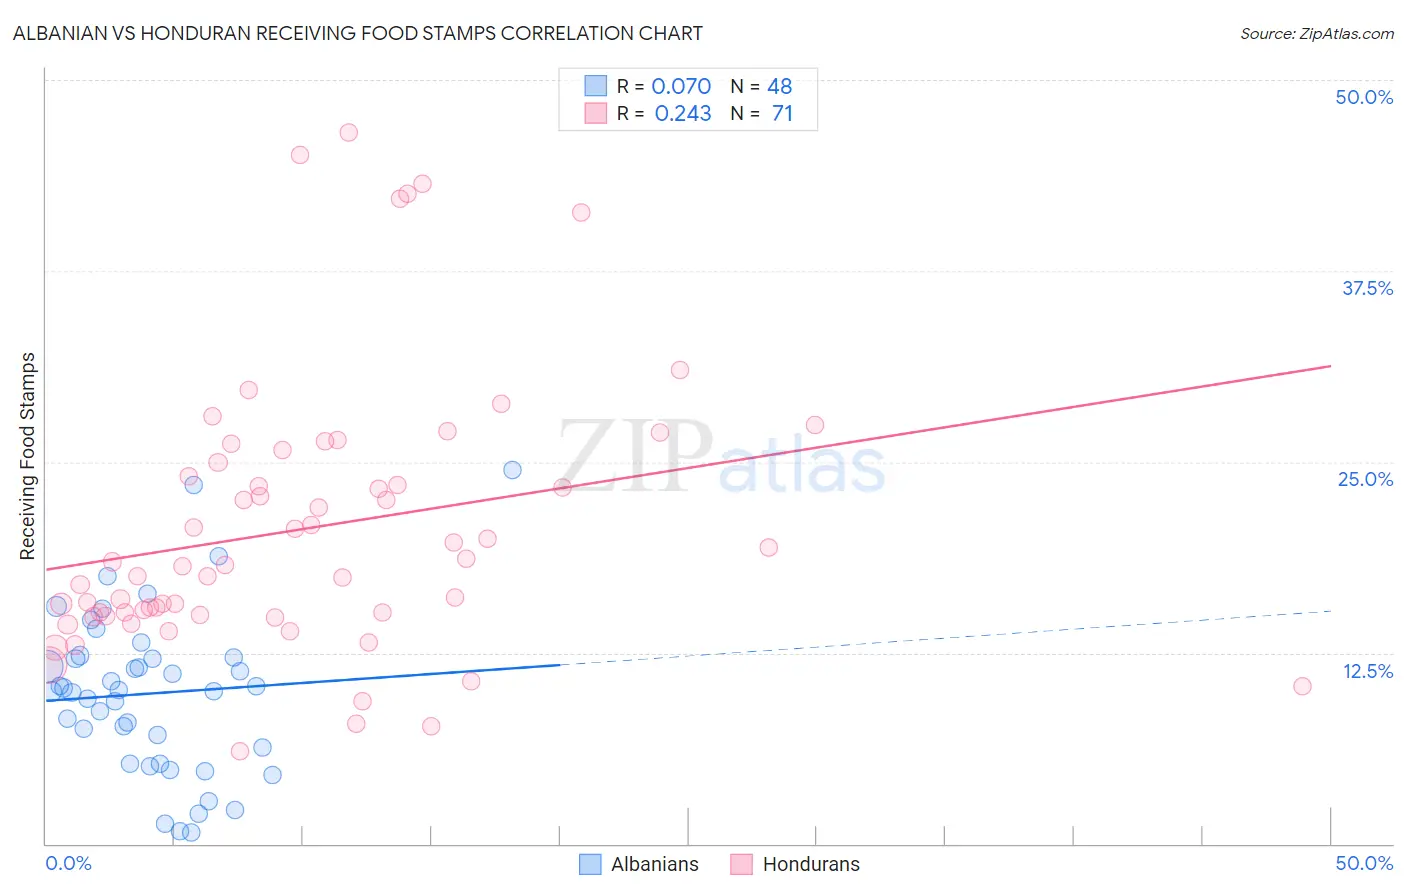
Albanian vs Honduran Receiving Food Stamps Correlation Chart
The statistical analysis conducted on geographies consisting of 192,875,347 people shows a slight positive correlation between the proportion of Albanians and percentage of population receiving government assistance and/or food stamps in the United States with a correlation coefficient (R) of 0.070 and weighted average of 12.0%. Similarly, the statistical analysis conducted on geographies consisting of 357,240,438 people shows a weak positive correlation between the proportion of Hondurans and percentage of population receiving government assistance and/or food stamps in the United States with a correlation coefficient (R) of 0.243 and weighted average of 15.5%, a difference of 29.7%.
Receiving Food Stamps Correlation Summary
| Measurement | Albanian | Honduran |
| Minimum | 0.70% | 6.1% |
| Maximum | 24.5% | 46.6% |
| Range | 23.8% | 40.5% |
| Mean | 9.8% | 20.7% |
| Median | 10.0% | 18.2% |
| Interquartile 25% (IQ1) | 5.8% | 14.9% |
| Interquartile 75% (IQ3) | 12.2% | 25.0% |
| Interquartile Range (IQR) | 6.4% | 10.0% |
| Standard Deviation (Sample) | 5.3% | 8.9% |
| Standard Deviation (Population) | 5.2% | 8.9% |
Similar Demographics by Receiving Food Stamps
Demographics Similar to Albanians by Receiving Food Stamps
In terms of receiving food stamps, the demographic groups most similar to Albanians are Spanish (12.0%, a difference of 0.22%), Immigrants from Iraq (12.0%, a difference of 0.25%), Sudanese (12.0%, a difference of 0.31%), Immigrants from Cameroon (12.0%, a difference of 0.44%), and Immigrants from Peru (12.0%, a difference of 0.50%).
| Demographics | Rating | Rank | Receiving Food Stamps |
| Uruguayans | 44.8 /100 | #180 | Average 11.8% |
| South American Indians | 41.7 /100 | #181 | Average 11.9% |
| Immigrants | Morocco | 40.7 /100 | #182 | Average 11.9% |
| Immigrants | Uganda | 40.3 /100 | #183 | Average 11.9% |
| Spaniards | 39.8 /100 | #184 | Fair 11.9% |
| Immigrants | Iraq | 37.1 /100 | #185 | Fair 12.0% |
| Spanish | 36.9 /100 | #186 | Fair 12.0% |
| Albanians | 35.4 /100 | #187 | Fair 12.0% |
| Sudanese | 33.4 /100 | #188 | Fair 12.0% |
| Immigrants | Cameroon | 32.5 /100 | #189 | Fair 12.0% |
| Immigrants | Peru | 32.2 /100 | #190 | Fair 12.0% |
| Venezuelans | 32.1 /100 | #191 | Fair 12.0% |
| Samoans | 31.0 /100 | #192 | Fair 12.1% |
| Immigrants | Fiji | 27.8 /100 | #193 | Fair 12.1% |
| Immigrants | Sudan | 27.1 /100 | #194 | Fair 12.1% |
Demographics Similar to Hondurans by Receiving Food Stamps
In terms of receiving food stamps, the demographic groups most similar to Hondurans are Alaska Native (15.6%, a difference of 0.44%), Vietnamese (15.7%, a difference of 0.74%), Immigrants from Latin America (15.7%, a difference of 0.85%), Senegalese (15.4%, a difference of 1.0%), and Immigrants from Honduras (15.7%, a difference of 1.2%).
| Demographics | Rating | Rank | Receiving Food Stamps |
| Immigrants | Ecuador | 0.0 /100 | #284 | Tragic 15.0% |
| Immigrants | Liberia | 0.0 /100 | #285 | Tragic 15.1% |
| Africans | 0.0 /100 | #286 | Tragic 15.1% |
| Immigrants | Mexico | 0.0 /100 | #287 | Tragic 15.2% |
| Immigrants | Belize | 0.0 /100 | #288 | Tragic 15.2% |
| Immigrants | Senegal | 0.0 /100 | #289 | Tragic 15.3% |
| Senegalese | 0.0 /100 | #290 | Tragic 15.4% |
| Hondurans | 0.0 /100 | #291 | Tragic 15.5% |
| Alaska Natives | 0.0 /100 | #292 | Tragic 15.6% |
| Vietnamese | 0.0 /100 | #293 | Tragic 15.7% |
| Immigrants | Latin America | 0.0 /100 | #294 | Tragic 15.7% |
| Immigrants | Honduras | 0.0 /100 | #295 | Tragic 15.7% |
| Tsimshian | 0.0 /100 | #296 | Tragic 15.7% |
| Immigrants | Bahamas | 0.0 /100 | #297 | Tragic 15.8% |
| Immigrants | Trinidad and Tobago | 0.0 /100 | #298 | Tragic 15.8% |