Czech vs Native Hawaiian Receiving Food Stamps
COMPARE
Czech
Native Hawaiian
Receiving Food Stamps
Receiving Food Stamps Comparison
Czechs
Native Hawaiians
9.2%
RECEIVING FOOD STAMPS
99.8/ 100
METRIC RATING
28th/ 347
METRIC RANK
12.8%
RECEIVING FOOD STAMPS
6.7/ 100
METRIC RATING
215th/ 347
METRIC RANK
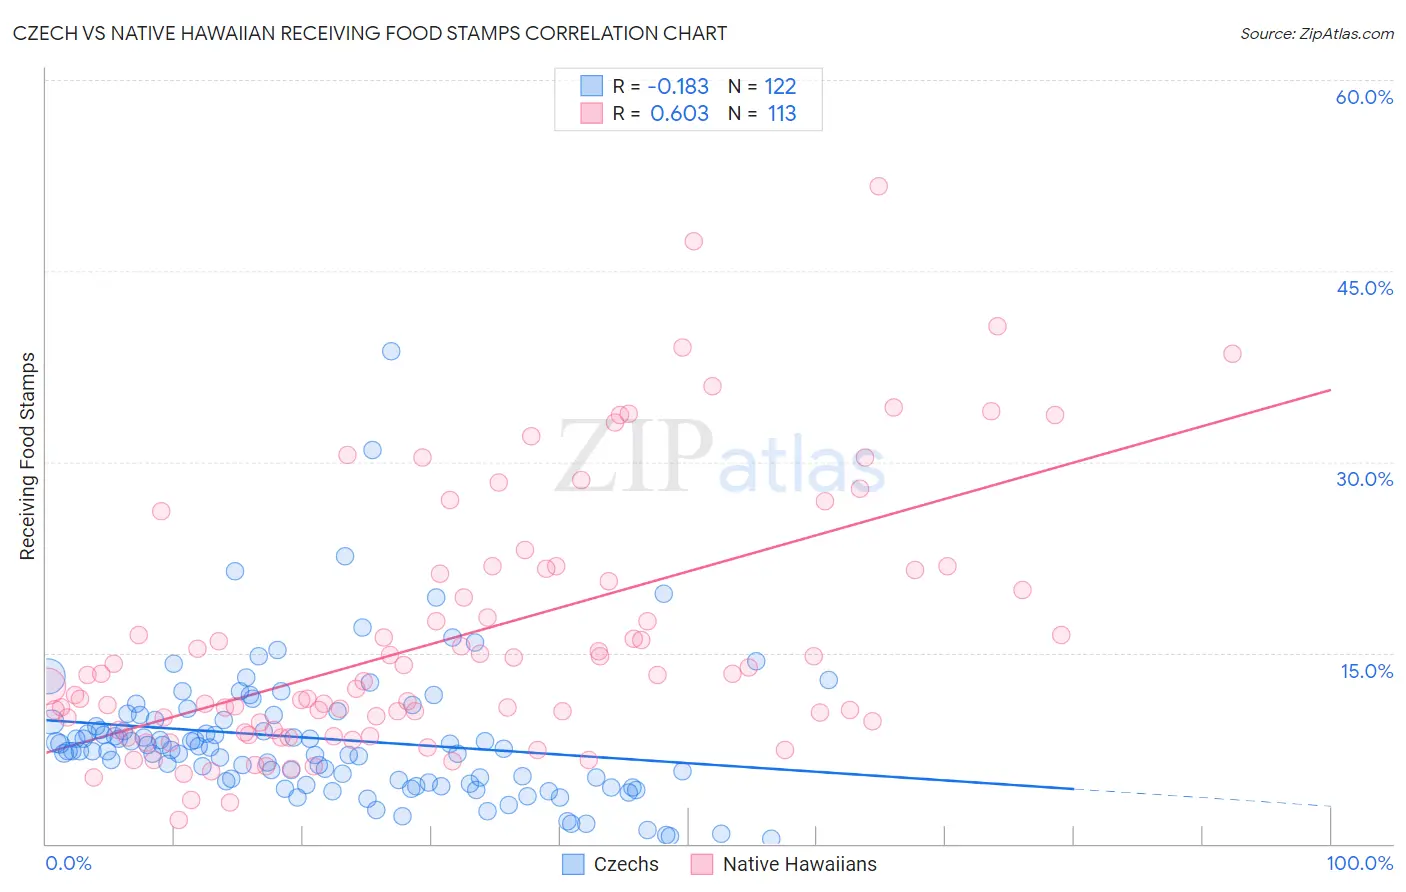
Czech vs Native Hawaiian Receiving Food Stamps Correlation Chart
The statistical analysis conducted on geographies consisting of 482,652,589 people shows a poor negative correlation between the proportion of Czechs and percentage of population receiving government assistance and/or food stamps in the United States with a correlation coefficient (R) of -0.183 and weighted average of 9.2%. Similarly, the statistical analysis conducted on geographies consisting of 331,508,254 people shows a significant positive correlation between the proportion of Native Hawaiians and percentage of population receiving government assistance and/or food stamps in the United States with a correlation coefficient (R) of 0.603 and weighted average of 12.8%, a difference of 39.1%.
Receiving Food Stamps Correlation Summary
| Measurement | Czech | Native Hawaiian |
| Minimum | 0.40% | 1.9% |
| Maximum | 38.7% | 51.7% |
| Range | 38.3% | 49.8% |
| Mean | 8.3% | 16.1% |
| Median | 7.5% | 12.8% |
| Interquartile 25% (IQ1) | 4.9% | 9.0% |
| Interquartile 75% (IQ3) | 9.7% | 21.4% |
| Interquartile Range (IQR) | 4.8% | 12.4% |
| Standard Deviation (Sample) | 5.5% | 10.1% |
| Standard Deviation (Population) | 5.4% | 10.1% |
Similar Demographics by Receiving Food Stamps
Demographics Similar to Czechs by Receiving Food Stamps
In terms of receiving food stamps, the demographic groups most similar to Czechs are Bhutanese (9.2%, a difference of 0.010%), Swedish (9.2%, a difference of 0.25%), Immigrants from Lithuania (9.2%, a difference of 0.27%), Immigrants from Ireland (9.2%, a difference of 0.45%), and Immigrants from Northern Europe (9.2%, a difference of 0.55%).
| Demographics | Rating | Rank | Receiving Food Stamps |
| Luxembourgers | 99.8 /100 | #21 | Exceptional 9.1% |
| Immigrants | Australia | 99.8 /100 | #22 | Exceptional 9.2% |
| Eastern Europeans | 99.8 /100 | #23 | Exceptional 9.2% |
| Immigrants | Northern Europe | 99.8 /100 | #24 | Exceptional 9.2% |
| Immigrants | Ireland | 99.8 /100 | #25 | Exceptional 9.2% |
| Swedes | 99.8 /100 | #26 | Exceptional 9.2% |
| Bhutanese | 99.8 /100 | #27 | Exceptional 9.2% |
| Czechs | 99.8 /100 | #28 | Exceptional 9.2% |
| Immigrants | Lithuania | 99.8 /100 | #29 | Exceptional 9.2% |
| Immigrants | Sweden | 99.7 /100 | #30 | Exceptional 9.3% |
| Immigrants | Eastern Asia | 99.7 /100 | #31 | Exceptional 9.3% |
| Bolivians | 99.7 /100 | #32 | Exceptional 9.3% |
| Zimbabweans | 99.6 /100 | #33 | Exceptional 9.5% |
| Turks | 99.6 /100 | #34 | Exceptional 9.5% |
| Immigrants | Austria | 99.6 /100 | #35 | Exceptional 9.5% |
Demographics Similar to Native Hawaiians by Receiving Food Stamps
In terms of receiving food stamps, the demographic groups most similar to Native Hawaiians are Immigrants from South America (12.8%, a difference of 0.11%), Immigrants from Burma/Myanmar (12.9%, a difference of 0.36%), Immigrants from Africa (12.8%, a difference of 0.44%), Moroccan (12.8%, a difference of 0.47%), and Hawaiian (12.9%, a difference of 0.73%).
| Demographics | Rating | Rank | Receiving Food Stamps |
| Potawatomi | 14.6 /100 | #208 | Poor 12.5% |
| Immigrants | Sierra Leone | 12.9 /100 | #209 | Poor 12.5% |
| Immigrants | Uruguay | 12.8 /100 | #210 | Poor 12.5% |
| Colombians | 10.2 /100 | #211 | Poor 12.6% |
| Malaysians | 8.5 /100 | #212 | Tragic 12.7% |
| Moroccans | 7.6 /100 | #213 | Tragic 12.8% |
| Immigrants | Africa | 7.6 /100 | #214 | Tragic 12.8% |
| Native Hawaiians | 6.7 /100 | #215 | Tragic 12.8% |
| Immigrants | South America | 6.5 /100 | #216 | Tragic 12.8% |
| Immigrants | Burma/Myanmar | 6.0 /100 | #217 | Tragic 12.9% |
| Hawaiians | 5.4 /100 | #218 | Tragic 12.9% |
| Immigrants | Middle Africa | 5.4 /100 | #219 | Tragic 12.9% |
| Immigrants | Colombia | 5.3 /100 | #220 | Tragic 12.9% |
| Bermudans | 4.8 /100 | #221 | Tragic 13.0% |
| Immigrants | Immigrants | 4.4 /100 | #222 | Tragic 13.0% |