Albanian vs Immigrants from Moldova Receiving Food Stamps
COMPARE
Albanian
Immigrants from Moldova
Receiving Food Stamps
Receiving Food Stamps Comparison
Albanians
Immigrants from Moldova
12.0%
RECEIVING FOOD STAMPS
35.4/ 100
METRIC RATING
187th/ 347
METRIC RANK
10.9%
RECEIVING FOOD STAMPS
88.5/ 100
METRIC RATING
138th/ 347
METRIC RANK
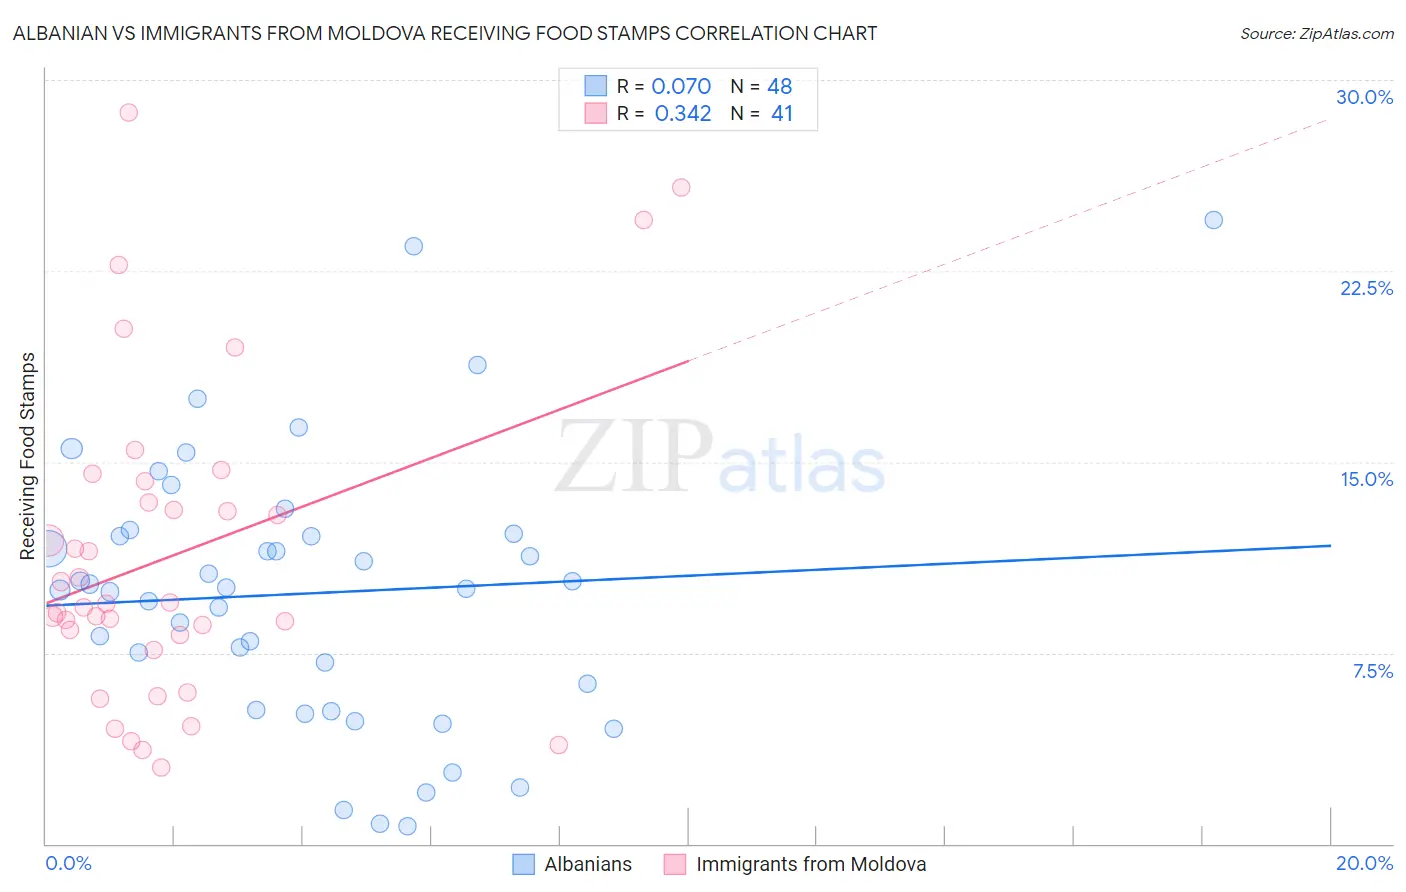
Albanian vs Immigrants from Moldova Receiving Food Stamps Correlation Chart
The statistical analysis conducted on geographies consisting of 192,875,347 people shows a slight positive correlation between the proportion of Albanians and percentage of population receiving government assistance and/or food stamps in the United States with a correlation coefficient (R) of 0.070 and weighted average of 12.0%. Similarly, the statistical analysis conducted on geographies consisting of 124,289,346 people shows a mild positive correlation between the proportion of Immigrants from Moldova and percentage of population receiving government assistance and/or food stamps in the United States with a correlation coefficient (R) of 0.342 and weighted average of 10.9%, a difference of 10.0%.
Receiving Food Stamps Correlation Summary
| Measurement | Albanian | Immigrants from Moldova |
| Minimum | 0.70% | 3.0% |
| Maximum | 24.5% | 28.7% |
| Range | 23.8% | 25.7% |
| Mean | 9.8% | 11.3% |
| Median | 10.0% | 9.4% |
| Interquartile 25% (IQ1) | 5.8% | 7.9% |
| Interquartile 75% (IQ3) | 12.2% | 13.8% |
| Interquartile Range (IQR) | 6.4% | 5.9% |
| Standard Deviation (Sample) | 5.3% | 6.2% |
| Standard Deviation (Population) | 5.2% | 6.1% |
Similar Demographics by Receiving Food Stamps
Demographics Similar to Albanians by Receiving Food Stamps
In terms of receiving food stamps, the demographic groups most similar to Albanians are Spanish (12.0%, a difference of 0.22%), Immigrants from Iraq (12.0%, a difference of 0.25%), Sudanese (12.0%, a difference of 0.31%), Immigrants from Cameroon (12.0%, a difference of 0.44%), and Immigrants from Peru (12.0%, a difference of 0.50%).
| Demographics | Rating | Rank | Receiving Food Stamps |
| Uruguayans | 44.8 /100 | #180 | Average 11.8% |
| South American Indians | 41.7 /100 | #181 | Average 11.9% |
| Immigrants | Morocco | 40.7 /100 | #182 | Average 11.9% |
| Immigrants | Uganda | 40.3 /100 | #183 | Average 11.9% |
| Spaniards | 39.8 /100 | #184 | Fair 11.9% |
| Immigrants | Iraq | 37.1 /100 | #185 | Fair 12.0% |
| Spanish | 36.9 /100 | #186 | Fair 12.0% |
| Albanians | 35.4 /100 | #187 | Fair 12.0% |
| Sudanese | 33.4 /100 | #188 | Fair 12.0% |
| Immigrants | Cameroon | 32.5 /100 | #189 | Fair 12.0% |
| Immigrants | Peru | 32.2 /100 | #190 | Fair 12.0% |
| Venezuelans | 32.1 /100 | #191 | Fair 12.0% |
| Samoans | 31.0 /100 | #192 | Fair 12.1% |
| Immigrants | Fiji | 27.8 /100 | #193 | Fair 12.1% |
| Immigrants | Sudan | 27.1 /100 | #194 | Fair 12.1% |
Demographics Similar to Immigrants from Moldova by Receiving Food Stamps
In terms of receiving food stamps, the demographic groups most similar to Immigrants from Moldova are Hmong (10.9%, a difference of 0.040%), Celtic (10.9%, a difference of 0.24%), Immigrants from Eastern Europe (10.8%, a difference of 0.51%), Slovak (10.8%, a difference of 0.53%), and Immigrants from Vietnam (11.0%, a difference of 0.61%).
| Demographics | Rating | Rank | Receiving Food Stamps |
| French | 92.3 /100 | #131 | Exceptional 10.7% |
| Immigrants | Germany | 92.0 /100 | #132 | Exceptional 10.7% |
| Immigrants | Russia | 90.9 /100 | #133 | Exceptional 10.8% |
| Immigrants | Brazil | 90.3 /100 | #134 | Exceptional 10.8% |
| Argentineans | 90.2 /100 | #135 | Exceptional 10.8% |
| Slovaks | 89.8 /100 | #136 | Excellent 10.8% |
| Immigrants | Eastern Europe | 89.8 /100 | #137 | Excellent 10.8% |
| Immigrants | Moldova | 88.5 /100 | #138 | Excellent 10.9% |
| Hmong | 88.4 /100 | #139 | Excellent 10.9% |
| Celtics | 87.8 /100 | #140 | Excellent 10.9% |
| Immigrants | Vietnam | 86.7 /100 | #141 | Excellent 11.0% |
| Chileans | 86.2 /100 | #142 | Excellent 11.0% |
| Immigrants | Northern Africa | 86.0 /100 | #143 | Excellent 11.0% |
| Syrians | 85.5 /100 | #144 | Excellent 11.0% |
| Hungarians | 85.1 /100 | #145 | Excellent 11.0% |