Immigrants from Senegal vs Immigrants from Eastern Africa Family Poverty
COMPARE
Immigrants from Senegal
Immigrants from Eastern Africa
Family Poverty
Family Poverty Comparison
Immigrants from Senegal
Immigrants from Eastern Africa
11.7%
FAMILY POVERTY
0.0/ 100
METRIC RATING
298th/ 347
METRIC RANK
9.5%
FAMILY POVERTY
15.1/ 100
METRIC RATING
208th/ 347
METRIC RANK
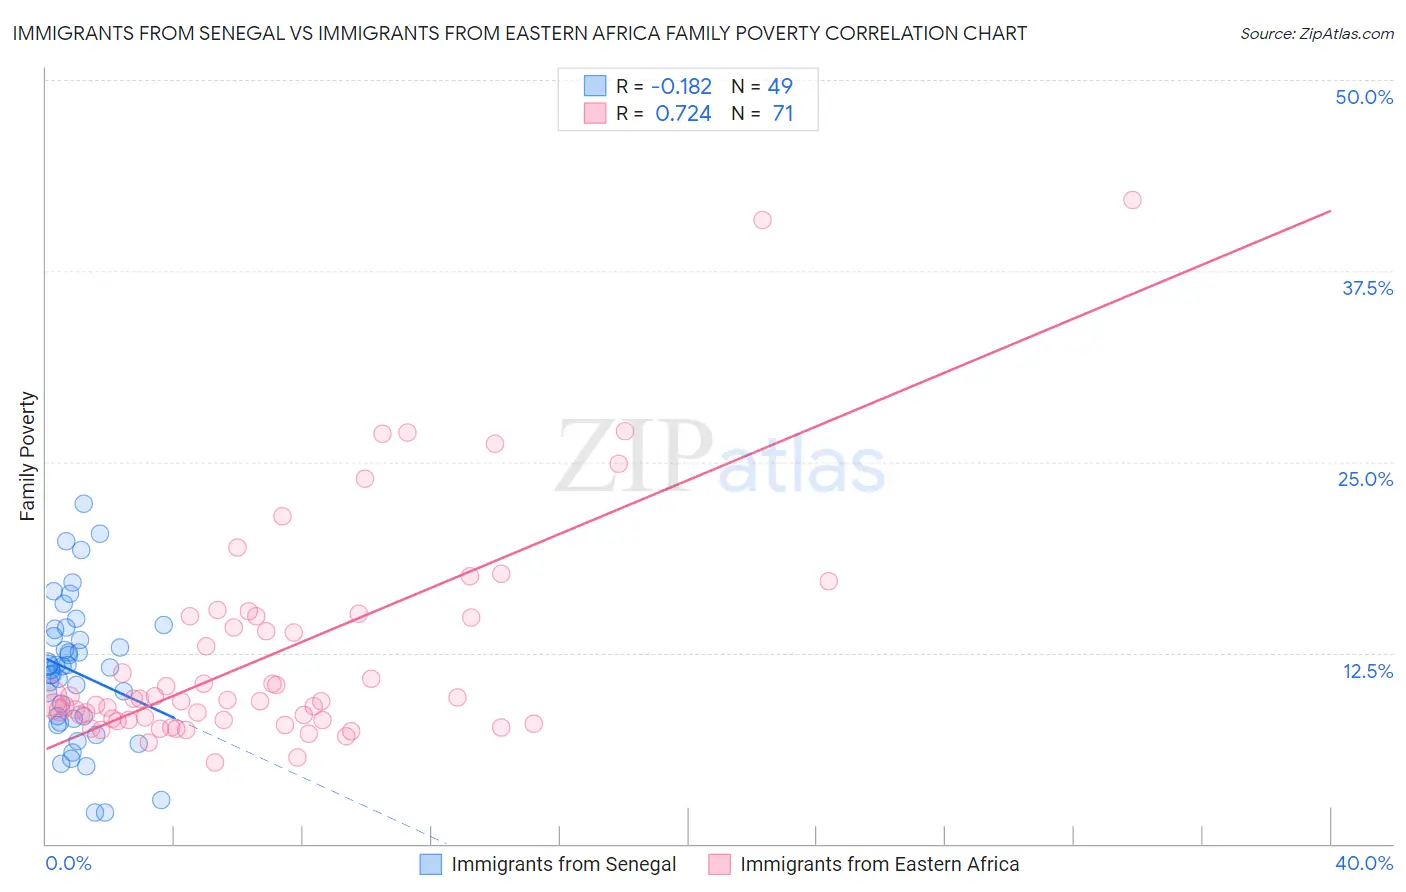
Immigrants from Senegal vs Immigrants from Eastern Africa Family Poverty Correlation Chart
The statistical analysis conducted on geographies consisting of 90,075,938 people shows a poor negative correlation between the proportion of Immigrants from Senegal and poverty level among families in the United States with a correlation coefficient (R) of -0.182 and weighted average of 11.7%. Similarly, the statistical analysis conducted on geographies consisting of 354,301,294 people shows a strong positive correlation between the proportion of Immigrants from Eastern Africa and poverty level among families in the United States with a correlation coefficient (R) of 0.724 and weighted average of 9.5%, a difference of 22.6%.
Family Poverty Correlation Summary
| Measurement | Immigrants from Senegal | Immigrants from Eastern Africa |
| Minimum | 2.0% | 5.3% |
| Maximum | 22.3% | 42.2% |
| Range | 20.2% | 36.8% |
| Mean | 11.2% | 12.5% |
| Median | 11.5% | 9.4% |
| Interquartile 25% (IQ1) | 8.1% | 8.1% |
| Interquartile 75% (IQ3) | 13.8% | 14.9% |
| Interquartile Range (IQR) | 5.7% | 6.7% |
| Standard Deviation (Sample) | 4.6% | 7.4% |
| Standard Deviation (Population) | 4.5% | 7.4% |
Similar Demographics by Family Poverty
Demographics Similar to Immigrants from Senegal by Family Poverty
In terms of family poverty, the demographic groups most similar to Immigrants from Senegal are Dutch West Indian (11.7%, a difference of 0.10%), Immigrants from Bangladesh (11.7%, a difference of 0.11%), Creek (11.7%, a difference of 0.14%), Bahamian (11.7%, a difference of 0.36%), and Choctaw (11.6%, a difference of 0.37%).
| Demographics | Rating | Rank | Family Poverty |
| Haitians | 0.0 /100 | #291 | Tragic 11.5% |
| Immigrants | Somalia | 0.0 /100 | #292 | Tragic 11.5% |
| Immigrants | Cabo Verde | 0.0 /100 | #293 | Tragic 11.6% |
| Immigrants | St. Vincent and the Grenadines | 0.0 /100 | #294 | Tragic 11.6% |
| Immigrants | Haiti | 0.0 /100 | #295 | Tragic 11.6% |
| Choctaw | 0.0 /100 | #296 | Tragic 11.6% |
| Creek | 0.0 /100 | #297 | Tragic 11.7% |
| Immigrants | Senegal | 0.0 /100 | #298 | Tragic 11.7% |
| Dutch West Indians | 0.0 /100 | #299 | Tragic 11.7% |
| Immigrants | Bangladesh | 0.0 /100 | #300 | Tragic 11.7% |
| Bahamians | 0.0 /100 | #301 | Tragic 11.7% |
| Guatemalans | 0.0 /100 | #302 | Tragic 11.7% |
| Africans | 0.0 /100 | #303 | Tragic 11.8% |
| Immigrants | Latin America | 0.0 /100 | #304 | Tragic 11.8% |
| Mexicans | 0.0 /100 | #305 | Tragic 11.8% |
Demographics Similar to Immigrants from Eastern Africa by Family Poverty
In terms of family poverty, the demographic groups most similar to Immigrants from Eastern Africa are Sierra Leonean (9.5%, a difference of 0.11%), Immigrants from Uruguay (9.5%, a difference of 0.29%), Immigrants from South America (9.5%, a difference of 0.64%), Aleut (9.5%, a difference of 0.65%), and Immigrants from Lebanon (9.4%, a difference of 0.84%).
| Demographics | Rating | Rank | Family Poverty |
| Immigrants | Portugal | 20.5 /100 | #201 | Fair 9.4% |
| Immigrants | Sierra Leone | 19.6 /100 | #202 | Poor 9.4% |
| German Russians | 19.4 /100 | #203 | Poor 9.4% |
| Immigrants | Lebanon | 18.9 /100 | #204 | Poor 9.4% |
| Aleuts | 18.0 /100 | #205 | Poor 9.5% |
| Immigrants | South America | 18.0 /100 | #206 | Poor 9.5% |
| Sierra Leoneans | 15.6 /100 | #207 | Poor 9.5% |
| Immigrants | Eastern Africa | 15.1 /100 | #208 | Poor 9.5% |
| Immigrants | Uruguay | 14.0 /100 | #209 | Poor 9.5% |
| Alsatians | 11.3 /100 | #210 | Poor 9.6% |
| Malaysians | 10.6 /100 | #211 | Poor 9.6% |
| Immigrants | Thailand | 9.7 /100 | #212 | Tragic 9.7% |
| Osage | 8.0 /100 | #213 | Tragic 9.7% |
| Immigrants | Micronesia | 6.7 /100 | #214 | Tragic 9.8% |
| Immigrants | Nonimmigrants | 6.7 /100 | #215 | Tragic 9.8% |