Albanian vs Arab Single Male Poverty
COMPARE
Albanian
Arab
Single Male Poverty
Single Male Poverty Comparison
Albanians
Arabs
12.4%
SINGLE MALE POVERTY
90.6/ 100
METRIC RATING
118th/ 347
METRIC RANK
13.0%
SINGLE MALE POVERTY
27.0/ 100
METRIC RATING
190th/ 347
METRIC RANK
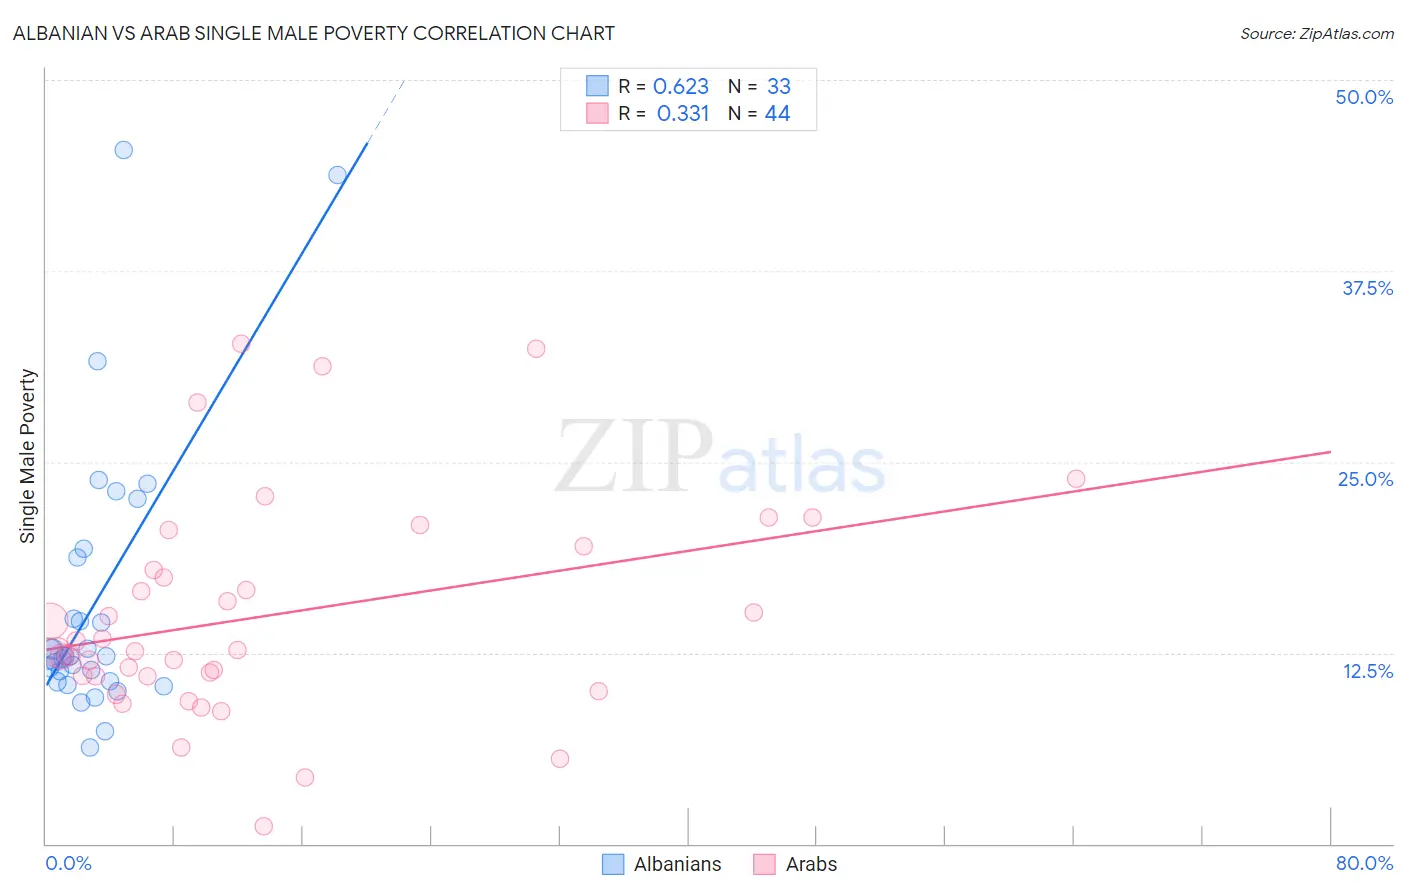
Albanian vs Arab Single Male Poverty Correlation Chart
The statistical analysis conducted on geographies consisting of 175,584,305 people shows a significant positive correlation between the proportion of Albanians and poverty level among single males in the United States with a correlation coefficient (R) of 0.623 and weighted average of 12.4%. Similarly, the statistical analysis conducted on geographies consisting of 420,354,980 people shows a mild positive correlation between the proportion of Arabs and poverty level among single males in the United States with a correlation coefficient (R) of 0.331 and weighted average of 13.0%, a difference of 4.4%.
Single Male Poverty Correlation Summary
| Measurement | Albanian | Arab |
| Minimum | 6.3% | 1.2% |
| Maximum | 45.5% | 32.8% |
| Range | 39.1% | 31.6% |
| Mean | 15.9% | 15.0% |
| Median | 12.3% | 12.7% |
| Interquartile 25% (IQ1) | 10.6% | 11.0% |
| Interquartile 75% (IQ3) | 19.0% | 18.7% |
| Interquartile Range (IQR) | 8.4% | 7.7% |
| Standard Deviation (Sample) | 9.2% | 7.2% |
| Standard Deviation (Population) | 9.1% | 7.1% |
Similar Demographics by Single Male Poverty
Demographics Similar to Albanians by Single Male Poverty
In terms of single male poverty, the demographic groups most similar to Albanians are Immigrants from Albania (12.4%, a difference of 0.030%), Immigrants from Oceania (12.4%, a difference of 0.10%), Immigrants from Syria (12.4%, a difference of 0.11%), Immigrants from Southern Europe (12.4%, a difference of 0.16%), and Venezuelan (12.4%, a difference of 0.17%).
| Demographics | Rating | Rank | Single Male Poverty |
| Immigrants | North Macedonia | 93.6 /100 | #111 | Exceptional 12.3% |
| Kenyans | 93.3 /100 | #112 | Exceptional 12.4% |
| Pakistanis | 92.4 /100 | #113 | Exceptional 12.4% |
| Nicaraguans | 92.1 /100 | #114 | Exceptional 12.4% |
| Immigrants | Southern Europe | 91.5 /100 | #115 | Exceptional 12.4% |
| Immigrants | Syria | 91.2 /100 | #116 | Exceptional 12.4% |
| Immigrants | Oceania | 91.1 /100 | #117 | Exceptional 12.4% |
| Albanians | 90.6 /100 | #118 | Exceptional 12.4% |
| Immigrants | Albania | 90.3 /100 | #119 | Exceptional 12.4% |
| Venezuelans | 89.4 /100 | #120 | Excellent 12.4% |
| Icelanders | 88.2 /100 | #121 | Excellent 12.5% |
| Serbians | 87.9 /100 | #122 | Excellent 12.5% |
| Immigrants | Kenya | 87.6 /100 | #123 | Excellent 12.5% |
| Russians | 87.3 /100 | #124 | Excellent 12.5% |
| Immigrants | Jordan | 87.1 /100 | #125 | Excellent 12.5% |
Demographics Similar to Arabs by Single Male Poverty
In terms of single male poverty, the demographic groups most similar to Arabs are Immigrants from Thailand (13.0%, a difference of 0.030%), Immigrants from Jamaica (13.0%, a difference of 0.040%), Immigrants from South Africa (13.0%, a difference of 0.060%), Liberian (13.0%, a difference of 0.12%), and Portuguese (12.9%, a difference of 0.21%).
| Demographics | Rating | Rank | Single Male Poverty |
| Immigrants | West Indies | 33.0 /100 | #183 | Fair 12.9% |
| Immigrants | Trinidad and Tobago | 32.5 /100 | #184 | Fair 12.9% |
| Norwegians | 32.0 /100 | #185 | Fair 12.9% |
| Nigerians | 31.9 /100 | #186 | Fair 12.9% |
| Immigrants | Kuwait | 31.9 /100 | #187 | Fair 12.9% |
| Macedonians | 31.5 /100 | #188 | Fair 12.9% |
| Portuguese | 30.2 /100 | #189 | Fair 12.9% |
| Arabs | 27.0 /100 | #190 | Fair 13.0% |
| Immigrants | Thailand | 26.6 /100 | #191 | Fair 13.0% |
| Immigrants | Jamaica | 26.5 /100 | #192 | Fair 13.0% |
| Immigrants | South Africa | 26.1 /100 | #193 | Fair 13.0% |
| Liberians | 25.2 /100 | #194 | Fair 13.0% |
| Immigrants | England | 23.4 /100 | #195 | Fair 13.0% |
| Immigrants | Grenada | 23.1 /100 | #196 | Fair 13.0% |
| Immigrants | Laos | 23.1 /100 | #197 | Fair 13.0% |