Albanian vs Arab Disability Age 18 to 34
COMPARE
Albanian
Arab
Disability Age 18 to 34
Disability Age 18 to 34 Comparison
Albanians
Arabs
6.4%
DISABILITY AGE 18 TO 34
85.3/ 100
METRIC RATING
144th/ 347
METRIC RANK
6.5%
DISABILITY AGE 18 TO 34
72.3/ 100
METRIC RATING
161st/ 347
METRIC RANK
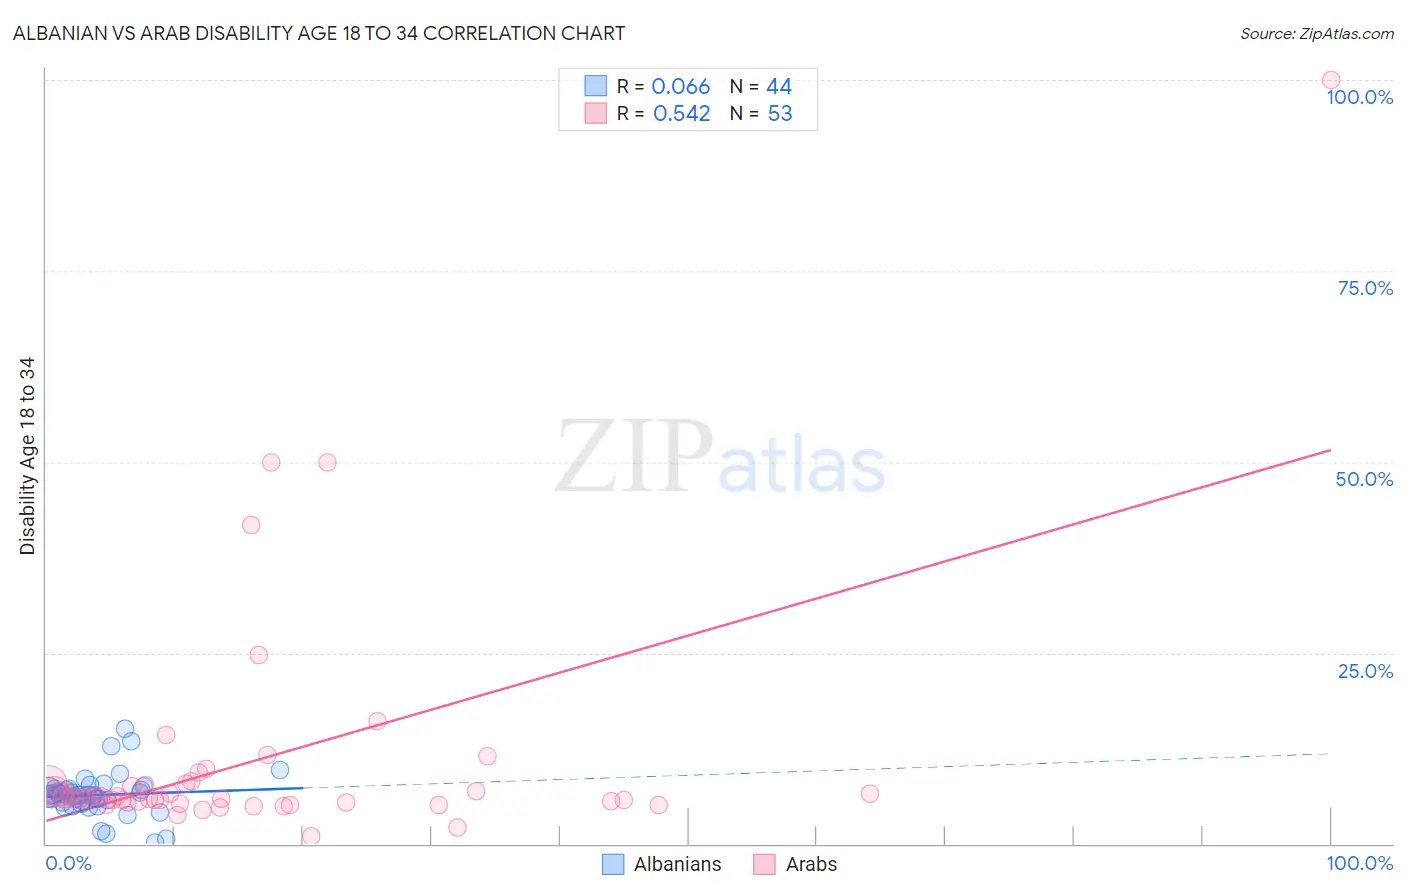
Albanian vs Arab Disability Age 18 to 34 Correlation Chart
The statistical analysis conducted on geographies consisting of 192,986,276 people shows a slight positive correlation between the proportion of Albanians and percentage of population with a disability between the ages 18 and 35 in the United States with a correlation coefficient (R) of 0.066 and weighted average of 6.4%. Similarly, the statistical analysis conducted on geographies consisting of 485,206,090 people shows a substantial positive correlation between the proportion of Arabs and percentage of population with a disability between the ages 18 and 35 in the United States with a correlation coefficient (R) of 0.542 and weighted average of 6.5%, a difference of 1.4%.
Disability Age 18 to 34 Correlation Summary
| Measurement | Albanian | Arab |
| Minimum | 0.20% | 0.92% |
| Maximum | 15.0% | 100.0% |
| Range | 14.8% | 99.1% |
| Mean | 6.4% | 10.9% |
| Median | 6.4% | 6.1% |
| Interquartile 25% (IQ1) | 5.3% | 5.4% |
| Interquartile 75% (IQ3) | 7.1% | 7.8% |
| Interquartile Range (IQR) | 1.8% | 2.4% |
| Standard Deviation (Sample) | 2.8% | 16.0% |
| Standard Deviation (Population) | 2.8% | 15.9% |
Demographics Similar to Albanians and Arabs by Disability Age 18 to 34
In terms of disability age 18 to 34, the demographic groups most similar to Albanians are Moroccan (6.4%, a difference of 0.0%), Belizean (6.4%, a difference of 0.060%), Immigrants from Latvia (6.4%, a difference of 0.17%), South American Indian (6.4%, a difference of 0.19%), and Immigrants from South Africa (6.4%, a difference of 0.22%). Similarly, the demographic groups most similar to Arabs are Immigrants from Southern Europe (6.5%, a difference of 0.020%), South African (6.5%, a difference of 0.060%), Dominican (6.5%, a difference of 0.11%), Zimbabwean (6.5%, a difference of 0.22%), and Immigrants from Sierra Leone (6.5%, a difference of 0.25%).
| Demographics | Rating | Rank | Disability Age 18 to 34 |
| South American Indians | 86.5 /100 | #142 | Excellent 6.4% |
| Immigrants | Latvia | 86.4 /100 | #143 | Excellent 6.4% |
| Albanians | 85.3 /100 | #144 | Excellent 6.4% |
| Moroccans | 85.2 /100 | #145 | Excellent 6.4% |
| Belizeans | 84.9 /100 | #146 | Excellent 6.4% |
| Immigrants | South Africa | 83.7 /100 | #147 | Excellent 6.4% |
| Immigrants | Belgium | 83.5 /100 | #148 | Excellent 6.4% |
| Hondurans | 83.1 /100 | #149 | Excellent 6.4% |
| Immigrants | Dominican Republic | 82.7 /100 | #150 | Excellent 6.4% |
| Tongans | 81.9 /100 | #151 | Excellent 6.4% |
| Bulgarians | 78.3 /100 | #152 | Good 6.5% |
| Immigrants | Eritrea | 77.4 /100 | #153 | Good 6.5% |
| Immigrants | Central America | 76.8 /100 | #154 | Good 6.5% |
| Inupiat | 76.7 /100 | #155 | Good 6.5% |
| Immigrants | Panama | 75.3 /100 | #156 | Good 6.5% |
| Immigrants | Sierra Leone | 75.0 /100 | #157 | Good 6.5% |
| Zimbabweans | 74.7 /100 | #158 | Good 6.5% |
| Dominicans | 73.6 /100 | #159 | Good 6.5% |
| Immigrants | Southern Europe | 72.5 /100 | #160 | Good 6.5% |
| Arabs | 72.3 /100 | #161 | Good 6.5% |
| South Africans | 71.7 /100 | #162 | Good 6.5% |