Alaska Native vs Maltese Bachelor's Degree
COMPARE
Alaska Native
Maltese
Bachelor's Degree
Bachelor's Degree Comparison
Alaska Natives
Maltese
29.4%
BACHELOR'S DEGREE
0.0/ 100
METRIC RATING
313th/ 347
METRIC RANK
41.9%
BACHELOR'S DEGREE
98.8/ 100
METRIC RATING
92nd/ 347
METRIC RANK
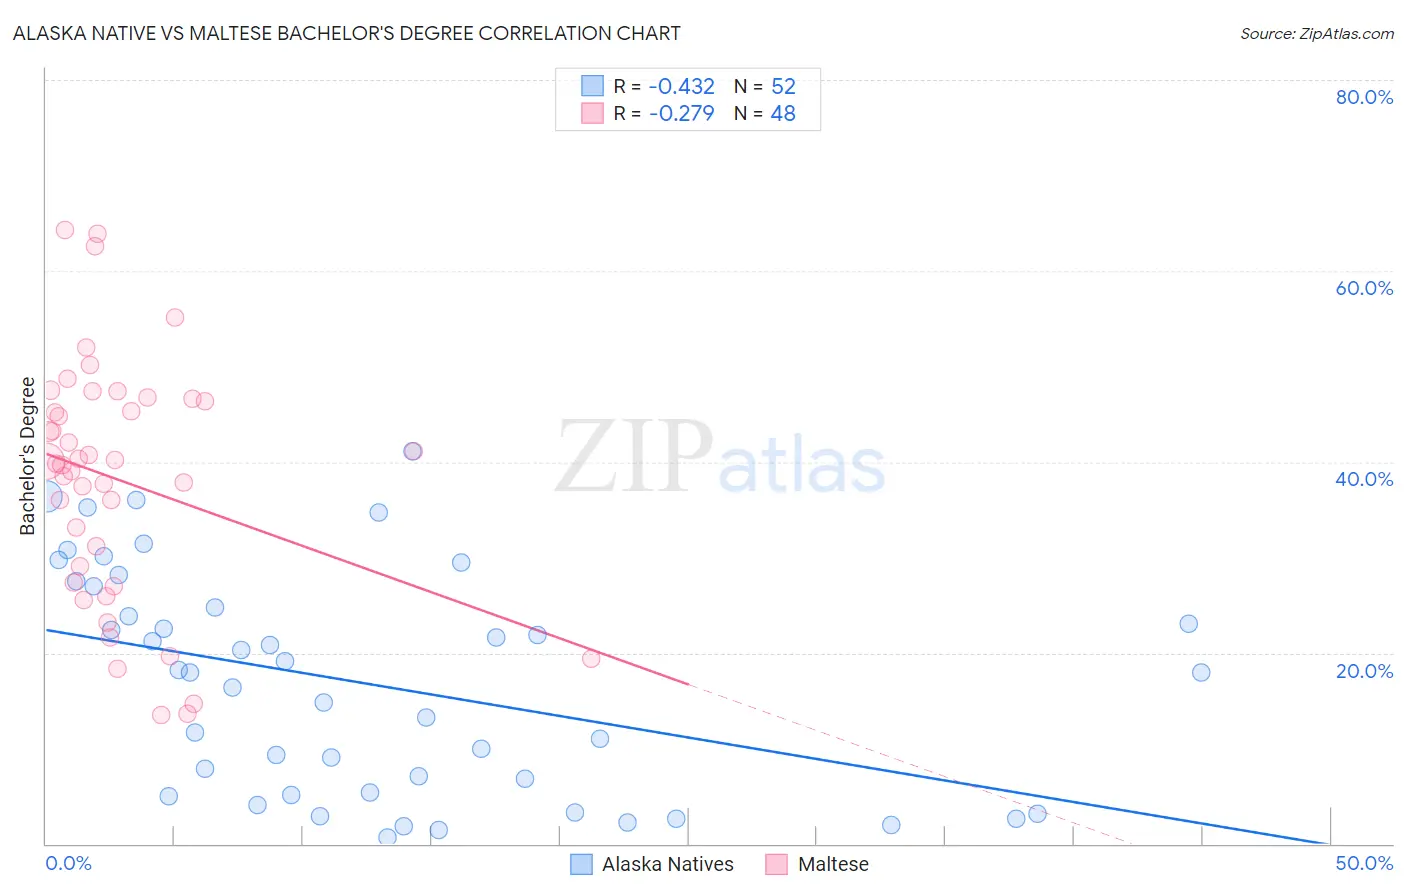
Alaska Native vs Maltese Bachelor's Degree Correlation Chart
The statistical analysis conducted on geographies consisting of 76,776,170 people shows a moderate negative correlation between the proportion of Alaska Natives and percentage of population with at least bachelor's degree education in the United States with a correlation coefficient (R) of -0.432 and weighted average of 29.4%. Similarly, the statistical analysis conducted on geographies consisting of 126,471,941 people shows a weak negative correlation between the proportion of Maltese and percentage of population with at least bachelor's degree education in the United States with a correlation coefficient (R) of -0.279 and weighted average of 41.9%, a difference of 42.8%.
Bachelor's Degree Correlation Summary
| Measurement | Alaska Native | Maltese |
| Minimum | 0.66% | 13.5% |
| Maximum | 41.1% | 64.2% |
| Range | 40.4% | 50.8% |
| Mean | 16.8% | 38.1% |
| Median | 17.9% | 40.0% |
| Interquartile 25% (IQ1) | 5.2% | 28.2% |
| Interquartile 75% (IQ3) | 25.9% | 46.4% |
| Interquartile Range (IQR) | 20.6% | 18.3% |
| Standard Deviation (Sample) | 11.5% | 12.6% |
| Standard Deviation (Population) | 11.4% | 12.5% |
Similar Demographics by Bachelor's Degree
Demographics Similar to Alaska Natives by Bachelor's Degree
In terms of bachelor's degree, the demographic groups most similar to Alaska Natives are Seminole (29.4%, a difference of 0.18%), Choctaw (29.4%, a difference of 0.24%), Shoshone (29.3%, a difference of 0.29%), Cheyenne (29.4%, a difference of 0.31%), and Immigrants from Cabo Verde (29.2%, a difference of 0.37%).
| Demographics | Rating | Rank | Bachelor's Degree |
| Immigrants | Yemen | 0.0 /100 | #306 | Tragic 29.9% |
| Nepalese | 0.0 /100 | #307 | Tragic 29.9% |
| Cajuns | 0.0 /100 | #308 | Tragic 29.6% |
| Hispanics or Latinos | 0.0 /100 | #309 | Tragic 29.6% |
| Cheyenne | 0.0 /100 | #310 | Tragic 29.4% |
| Choctaw | 0.0 /100 | #311 | Tragic 29.4% |
| Seminole | 0.0 /100 | #312 | Tragic 29.4% |
| Alaska Natives | 0.0 /100 | #313 | Tragic 29.4% |
| Shoshone | 0.0 /100 | #314 | Tragic 29.3% |
| Immigrants | Cabo Verde | 0.0 /100 | #315 | Tragic 29.2% |
| Sioux | 0.0 /100 | #316 | Tragic 29.1% |
| Colville | 0.0 /100 | #317 | Tragic 29.0% |
| Yaqui | 0.0 /100 | #318 | Tragic 29.0% |
| Creek | 0.0 /100 | #319 | Tragic 28.9% |
| Kiowa | 0.0 /100 | #320 | Tragic 28.8% |
Demographics Similar to Maltese by Bachelor's Degree
In terms of bachelor's degree, the demographic groups most similar to Maltese are Immigrants from Northern Africa (41.9%, a difference of 0.070%), Laotian (42.0%, a difference of 0.17%), Immigrants from Western Europe (42.0%, a difference of 0.30%), Greek (42.0%, a difference of 0.30%), and Carpatho Rusyn (42.1%, a difference of 0.42%).
| Demographics | Rating | Rank | Bachelor's Degree |
| Lithuanians | 99.2 /100 | #85 | Exceptional 42.2% |
| Immigrants | Brazil | 99.2 /100 | #86 | Exceptional 42.2% |
| Carpatho Rusyns | 99.0 /100 | #87 | Exceptional 42.1% |
| Immigrants | Western Europe | 99.0 /100 | #88 | Exceptional 42.0% |
| Greeks | 99.0 /100 | #89 | Exceptional 42.0% |
| Laotians | 98.9 /100 | #90 | Exceptional 42.0% |
| Immigrants | Northern Africa | 98.9 /100 | #91 | Exceptional 41.9% |
| Maltese | 98.8 /100 | #92 | Exceptional 41.9% |
| Immigrants | Canada | 98.6 /100 | #93 | Exceptional 41.7% |
| Immigrants | Nepal | 98.6 /100 | #94 | Exceptional 41.7% |
| Immigrants | North America | 98.5 /100 | #95 | Exceptional 41.7% |
| Immigrants | Moldova | 98.4 /100 | #96 | Exceptional 41.6% |
| Romanians | 98.4 /100 | #97 | Exceptional 41.6% |
| Immigrants | Ukraine | 98.3 /100 | #98 | Exceptional 41.5% |
| Immigrants | England | 98.1 /100 | #99 | Exceptional 41.4% |