African vs Immigrants from Russia Single Male Poverty
COMPARE
African
Immigrants from Russia
Single Male Poverty
Single Male Poverty Comparison
Africans
Immigrants from Russia
14.7%
SINGLE MALE POVERTY
0.0/ 100
METRIC RATING
296th/ 347
METRIC RANK
11.9%
SINGLE MALE POVERTY
99.6/ 100
METRIC RATING
69th/ 347
METRIC RANK
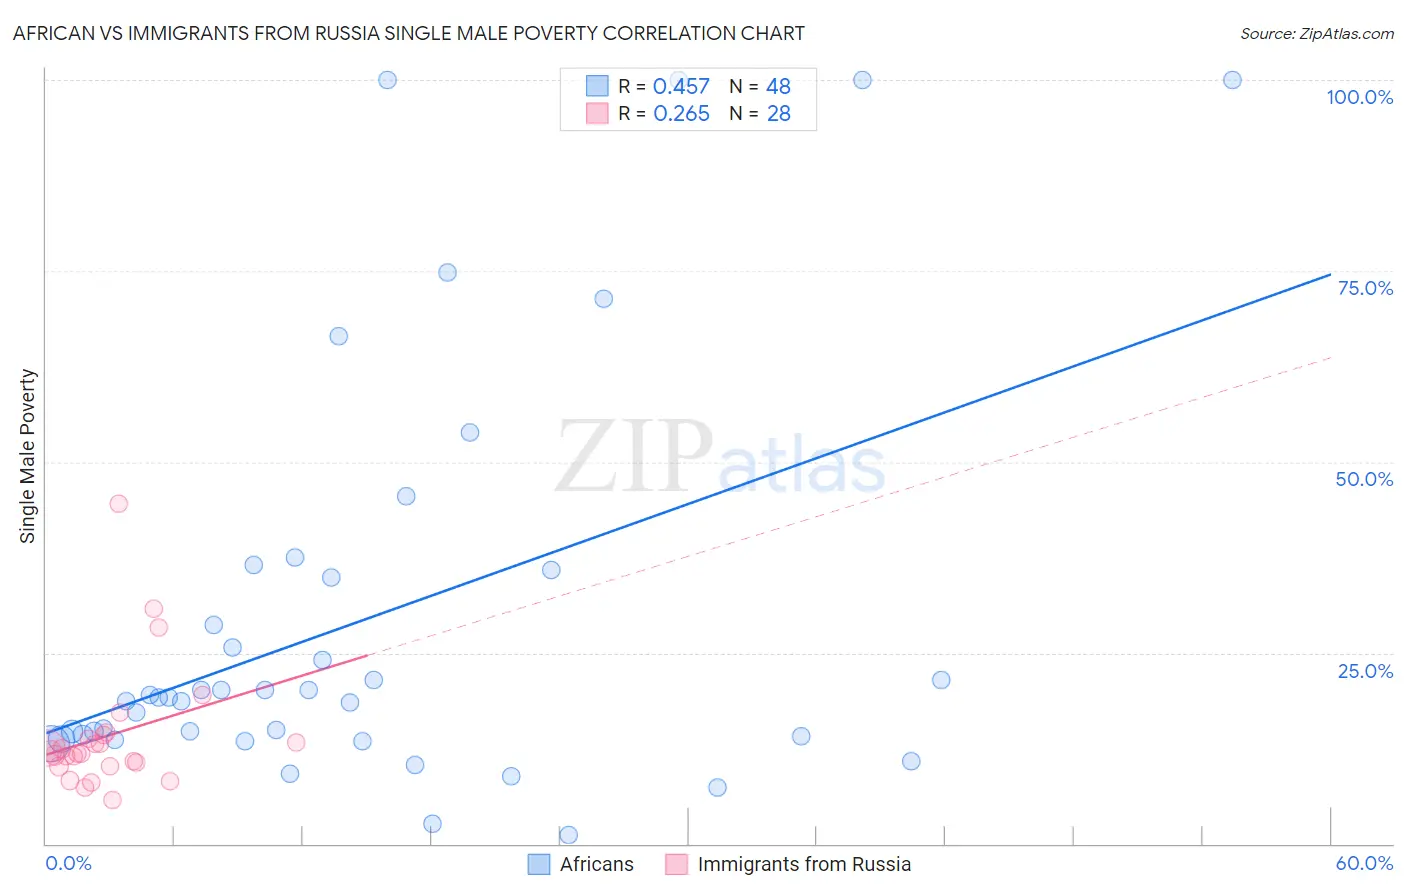
African vs Immigrants from Russia Single Male Poverty Correlation Chart
The statistical analysis conducted on geographies consisting of 417,076,777 people shows a moderate positive correlation between the proportion of Africans and poverty level among single males in the United States with a correlation coefficient (R) of 0.457 and weighted average of 14.7%. Similarly, the statistical analysis conducted on geographies consisting of 307,851,464 people shows a weak positive correlation between the proportion of Immigrants from Russia and poverty level among single males in the United States with a correlation coefficient (R) of 0.265 and weighted average of 11.9%, a difference of 24.1%.
Single Male Poverty Correlation Summary
| Measurement | African | Immigrants from Russia |
| Minimum | 1.1% | 5.8% |
| Maximum | 100.0% | 44.6% |
| Range | 98.9% | 38.8% |
| Mean | 29.4% | 14.2% |
| Median | 19.1% | 11.9% |
| Interquartile 25% (IQ1) | 13.9% | 10.4% |
| Interquartile 75% (IQ3) | 35.4% | 14.0% |
| Interquartile Range (IQR) | 21.5% | 3.6% |
| Standard Deviation (Sample) | 26.8% | 8.1% |
| Standard Deviation (Population) | 26.6% | 7.9% |
Similar Demographics by Single Male Poverty
Demographics Similar to Africans by Single Male Poverty
In terms of single male poverty, the demographic groups most similar to Africans are Scotch-Irish (14.7%, a difference of 0.33%), Immigrants from Dominican Republic (14.8%, a difference of 0.35%), Ottawa (14.6%, a difference of 0.77%), French Canadian (14.6%, a difference of 0.95%), and Nonimmigrants (14.6%, a difference of 1.1%).
| Demographics | Rating | Rank | Single Male Poverty |
| Immigrants | Dominica | 0.0 /100 | #289 | Tragic 14.5% |
| U.S. Virgin Islanders | 0.0 /100 | #290 | Tragic 14.5% |
| Bahamians | 0.0 /100 | #291 | Tragic 14.6% |
| Immigrants | Nonimmigrants | 0.0 /100 | #292 | Tragic 14.6% |
| French Canadians | 0.0 /100 | #293 | Tragic 14.6% |
| Ottawa | 0.0 /100 | #294 | Tragic 14.6% |
| Scotch-Irish | 0.0 /100 | #295 | Tragic 14.7% |
| Africans | 0.0 /100 | #296 | Tragic 14.7% |
| Immigrants | Dominican Republic | 0.0 /100 | #297 | Tragic 14.8% |
| French American Indians | 0.0 /100 | #298 | Tragic 15.0% |
| Delaware | 0.0 /100 | #299 | Tragic 15.0% |
| Cree | 0.0 /100 | #300 | Tragic 15.1% |
| Dominicans | 0.0 /100 | #301 | Tragic 15.2% |
| Alsatians | 0.0 /100 | #302 | Tragic 15.2% |
| Aleuts | 0.0 /100 | #303 | Tragic 15.4% |
Demographics Similar to Immigrants from Russia by Single Male Poverty
In terms of single male poverty, the demographic groups most similar to Immigrants from Russia are Immigrants from Croatia (11.9%, a difference of 0.020%), Immigrants from Nepal (11.9%, a difference of 0.020%), Immigrants from Ukraine (11.9%, a difference of 0.040%), Laotian (11.9%, a difference of 0.060%), and Immigrants from Uruguay (11.9%, a difference of 0.060%).
| Demographics | Rating | Rank | Single Male Poverty |
| Immigrants | Sri Lanka | 99.7 /100 | #62 | Exceptional 11.8% |
| Immigrants | Belarus | 99.7 /100 | #63 | Exceptional 11.8% |
| Immigrants | Eastern Europe | 99.6 /100 | #64 | Exceptional 11.8% |
| Laotians | 99.6 /100 | #65 | Exceptional 11.9% |
| Immigrants | Uruguay | 99.6 /100 | #66 | Exceptional 11.9% |
| Immigrants | Ukraine | 99.6 /100 | #67 | Exceptional 11.9% |
| Immigrants | Croatia | 99.6 /100 | #68 | Exceptional 11.9% |
| Immigrants | Russia | 99.6 /100 | #69 | Exceptional 11.9% |
| Immigrants | Nepal | 99.6 /100 | #70 | Exceptional 11.9% |
| Immigrants | Greece | 99.6 /100 | #71 | Exceptional 11.9% |
| Immigrants | Argentina | 99.5 /100 | #72 | Exceptional 11.9% |
| Argentineans | 99.5 /100 | #73 | Exceptional 11.9% |
| Chileans | 99.5 /100 | #74 | Exceptional 11.9% |
| Uruguayans | 99.4 /100 | #75 | Exceptional 11.9% |
| Immigrants | Northern Africa | 99.4 /100 | #76 | Exceptional 11.9% |