Afghan vs Immigrants from Vietnam 4th Grade
COMPARE
Afghan
Immigrants from Vietnam
4th Grade
4th Grade Comparison
Afghans
Immigrants from Vietnam
96.9%
4TH GRADE
0.1/ 100
METRIC RATING
279th/ 347
METRIC RANK
96.0%
4TH GRADE
0.0/ 100
METRIC RATING
322nd/ 347
METRIC RANK
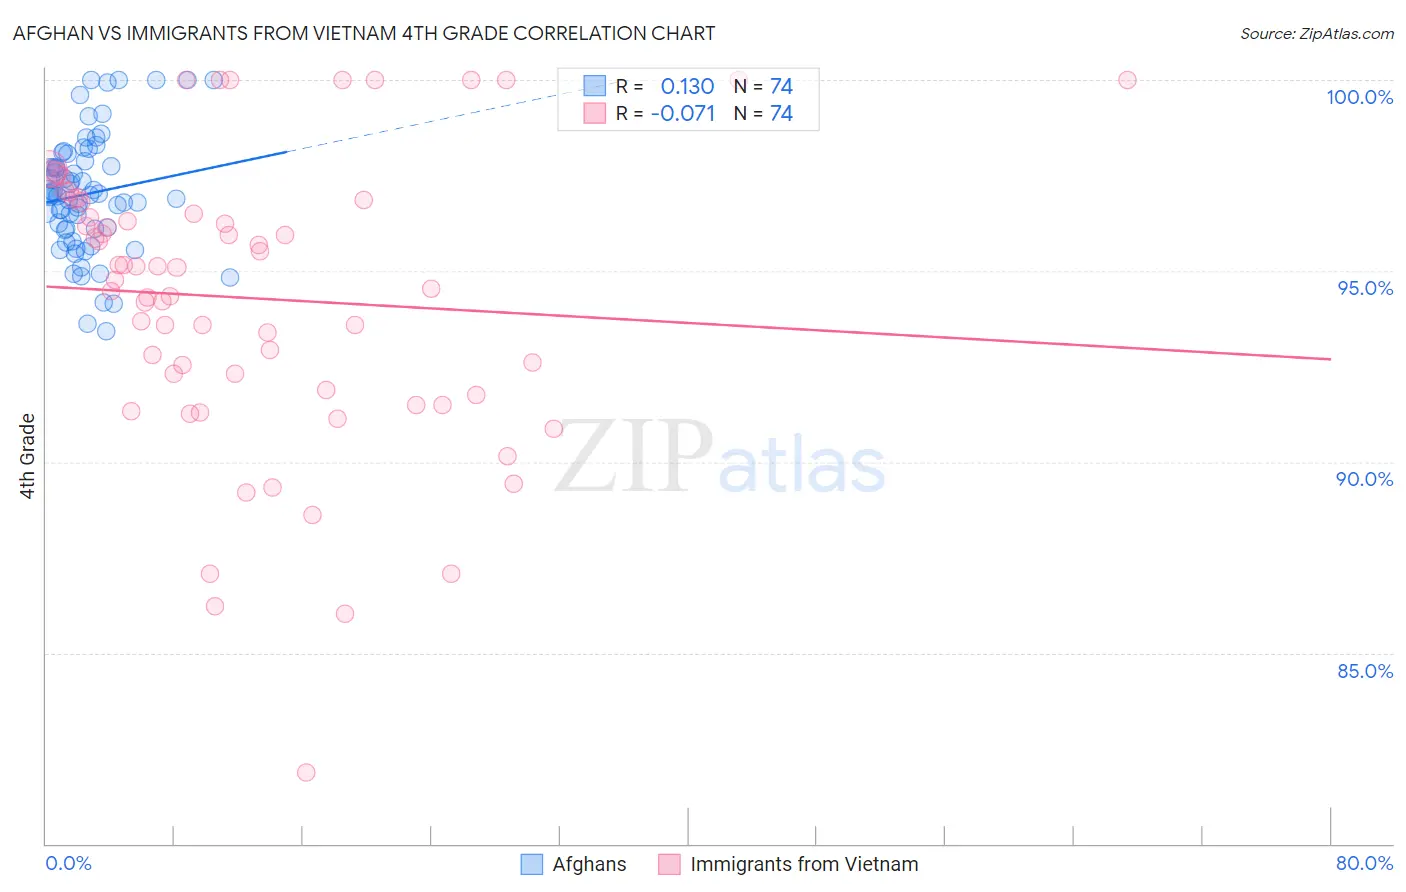
Afghan vs Immigrants from Vietnam 4th Grade Correlation Chart
The statistical analysis conducted on geographies consisting of 148,851,685 people shows a poor positive correlation between the proportion of Afghans and percentage of population with at least 4th grade education in the United States with a correlation coefficient (R) of 0.130 and weighted average of 96.9%. Similarly, the statistical analysis conducted on geographies consisting of 404,844,130 people shows a slight negative correlation between the proportion of Immigrants from Vietnam and percentage of population with at least 4th grade education in the United States with a correlation coefficient (R) of -0.071 and weighted average of 96.0%, a difference of 0.89%.
4th Grade Correlation Summary
| Measurement | Afghan | Immigrants from Vietnam |
| Minimum | 93.4% | 81.9% |
| Maximum | 100.0% | 100.0% |
| Range | 6.6% | 18.1% |
| Mean | 97.0% | 94.3% |
| Median | 97.0% | 94.9% |
| Interquartile 25% (IQ1) | 96.1% | 91.9% |
| Interquartile 75% (IQ3) | 97.9% | 96.8% |
| Interquartile Range (IQR) | 1.8% | 4.9% |
| Standard Deviation (Sample) | 1.5% | 3.8% |
| Standard Deviation (Population) | 1.5% | 3.7% |
Similar Demographics by 4th Grade
Demographics Similar to Afghans by 4th Grade
In terms of 4th grade, the demographic groups most similar to Afghans are Yaqui (96.9%, a difference of 0.010%), Immigrants from Western Africa (96.9%, a difference of 0.010%), Immigrants from Bolivia (96.9%, a difference of 0.010%), Barbadian (96.9%, a difference of 0.010%), and Trinidadian and Tobagonian (96.9%, a difference of 0.020%).
| Demographics | Rating | Rank | 4th Grade |
| Fijians | 0.1 /100 | #272 | Tragic 96.9% |
| Immigrants | Cameroon | 0.1 /100 | #273 | Tragic 96.9% |
| Trinidadians and Tobagonians | 0.1 /100 | #274 | Tragic 96.9% |
| Immigrants | Ghana | 0.1 /100 | #275 | Tragic 96.9% |
| Yaqui | 0.1 /100 | #276 | Tragic 96.9% |
| Immigrants | Western Africa | 0.1 /100 | #277 | Tragic 96.9% |
| Immigrants | Bolivia | 0.1 /100 | #278 | Tragic 96.9% |
| Afghans | 0.1 /100 | #279 | Tragic 96.9% |
| Barbadians | 0.1 /100 | #280 | Tragic 96.9% |
| Immigrants | Hong Kong | 0.1 /100 | #281 | Tragic 96.9% |
| Immigrants | Trinidad and Tobago | 0.1 /100 | #282 | Tragic 96.8% |
| Immigrants | Philippines | 0.1 /100 | #283 | Tragic 96.8% |
| Immigrants | St. Vincent and the Grenadines | 0.1 /100 | #284 | Tragic 96.8% |
| Immigrants | Barbados | 0.0 /100 | #285 | Tragic 96.8% |
| Immigrants | Thailand | 0.0 /100 | #286 | Tragic 96.8% |
Demographics Similar to Immigrants from Vietnam by 4th Grade
In terms of 4th grade, the demographic groups most similar to Immigrants from Vietnam are Japanese (96.0%, a difference of 0.0%), Immigrants from Nicaragua (96.0%, a difference of 0.020%), Immigrants from Belize (96.0%, a difference of 0.030%), Dominican (96.0%, a difference of 0.040%), and Hispanic or Latino (96.0%, a difference of 0.050%).
| Demographics | Rating | Rank | 4th Grade |
| Nicaraguans | 0.0 /100 | #315 | Tragic 96.2% |
| Immigrants | Ecuador | 0.0 /100 | #316 | Tragic 96.2% |
| Central American Indians | 0.0 /100 | #317 | Tragic 96.2% |
| Immigrants | Azores | 0.0 /100 | #318 | Tragic 96.1% |
| Belizeans | 0.0 /100 | #319 | Tragic 96.1% |
| Bangladeshis | 0.0 /100 | #320 | Tragic 96.1% |
| Japanese | 0.0 /100 | #321 | Tragic 96.0% |
| Immigrants | Vietnam | 0.0 /100 | #322 | Tragic 96.0% |
| Immigrants | Nicaragua | 0.0 /100 | #323 | Tragic 96.0% |
| Immigrants | Belize | 0.0 /100 | #324 | Tragic 96.0% |
| Dominicans | 0.0 /100 | #325 | Tragic 96.0% |
| Hispanics or Latinos | 0.0 /100 | #326 | Tragic 96.0% |
| Hondurans | 0.0 /100 | #327 | Tragic 96.0% |
| Mexican American Indians | 0.0 /100 | #328 | Tragic 95.8% |
| Immigrants | Cambodia | 0.0 /100 | #329 | Tragic 95.8% |