Immigrants from Greece vs English Single Mother Poverty
COMPARE
Immigrants from Greece
English
Single Mother Poverty
Single Mother Poverty Comparison
Immigrants from Greece
English
26.7%
SINGLE MOTHER POVERTY
99.9/ 100
METRIC RATING
41st/ 347
METRIC RANK
30.2%
SINGLE MOTHER POVERTY
4.8/ 100
METRIC RATING
230th/ 347
METRIC RANK
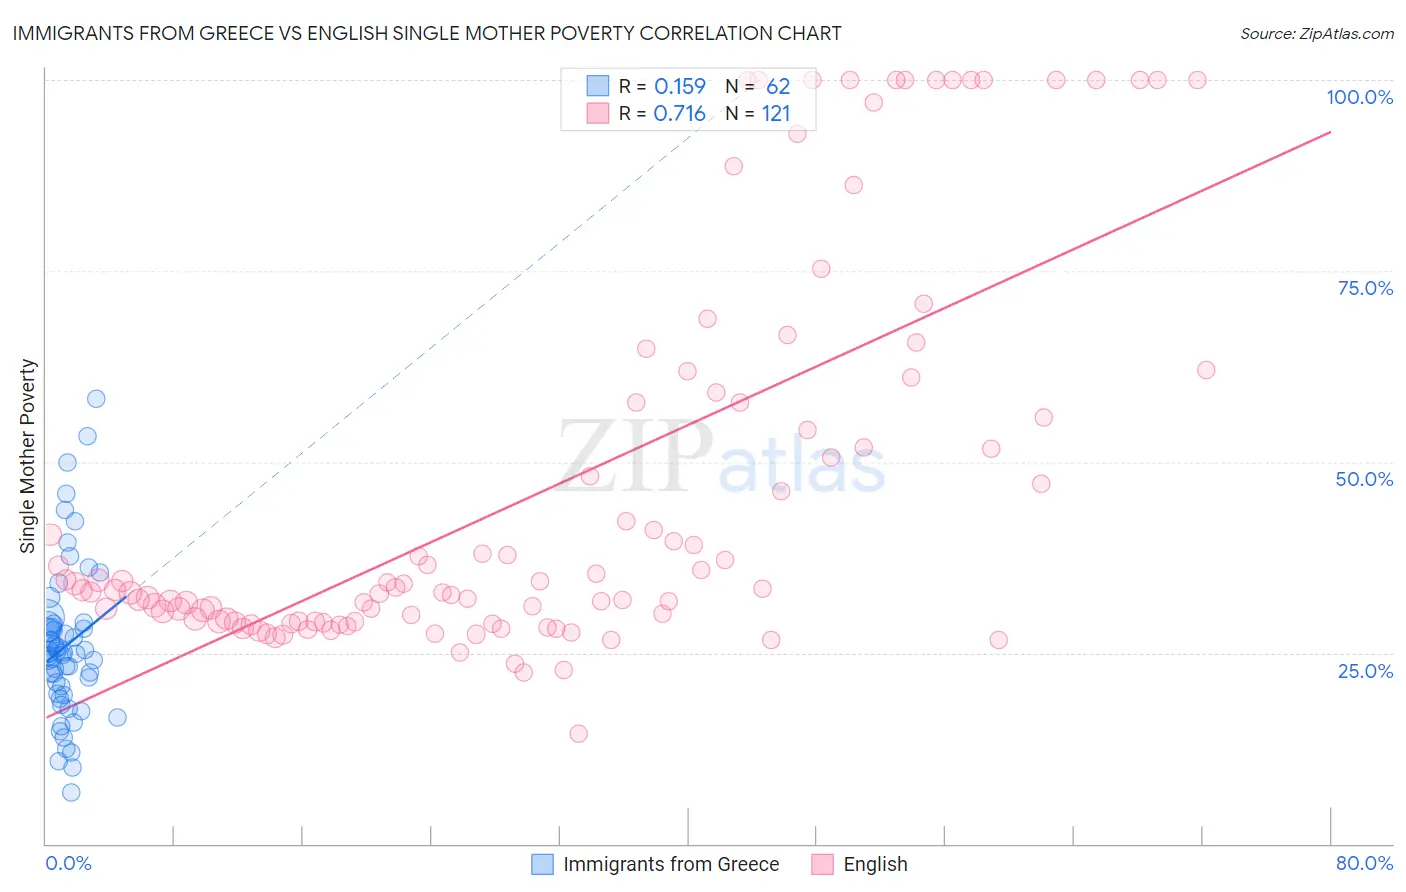
Immigrants from Greece vs English Single Mother Poverty Correlation Chart
The statistical analysis conducted on geographies consisting of 212,076,443 people shows a poor positive correlation between the proportion of Immigrants from Greece and poverty level among single mothers in the United States with a correlation coefficient (R) of 0.159 and weighted average of 26.7%. Similarly, the statistical analysis conducted on geographies consisting of 548,772,059 people shows a strong positive correlation between the proportion of English and poverty level among single mothers in the United States with a correlation coefficient (R) of 0.716 and weighted average of 30.2%, a difference of 13.0%.
Single Mother Poverty Correlation Summary
| Measurement | Immigrants from Greece | English |
| Minimum | 6.7% | 14.4% |
| Maximum | 58.3% | 100.0% |
| Range | 51.6% | 85.6% |
| Mean | 25.9% | 46.2% |
| Median | 24.9% | 33.3% |
| Interquartile 25% (IQ1) | 19.6% | 29.1% |
| Interquartile 75% (IQ3) | 28.5% | 57.7% |
| Interquartile Range (IQR) | 8.9% | 28.6% |
| Standard Deviation (Sample) | 10.2% | 25.2% |
| Standard Deviation (Population) | 10.1% | 25.1% |
Similar Demographics by Single Mother Poverty
Demographics Similar to Immigrants from Greece by Single Mother Poverty
In terms of single mother poverty, the demographic groups most similar to Immigrants from Greece are Immigrants from Vietnam (26.7%, a difference of 0.070%), Sri Lankan (26.7%, a difference of 0.17%), Armenian (26.8%, a difference of 0.23%), Tsimshian (26.8%, a difference of 0.31%), and Immigrants from Sierra Leone (26.9%, a difference of 0.45%).
| Demographics | Rating | Rank | Single Mother Poverty |
| Immigrants | Indonesia | 99.9 /100 | #34 | Exceptional 26.6% |
| Maltese | 99.9 /100 | #35 | Exceptional 26.6% |
| Okinawans | 99.9 /100 | #36 | Exceptional 26.6% |
| Immigrants | Israel | 99.9 /100 | #37 | Exceptional 26.6% |
| Immigrants | Fiji | 99.9 /100 | #38 | Exceptional 26.6% |
| Sri Lankans | 99.9 /100 | #39 | Exceptional 26.7% |
| Immigrants | Vietnam | 99.9 /100 | #40 | Exceptional 26.7% |
| Immigrants | Greece | 99.9 /100 | #41 | Exceptional 26.7% |
| Armenians | 99.9 /100 | #42 | Exceptional 26.8% |
| Tsimshian | 99.9 /100 | #43 | Exceptional 26.8% |
| Immigrants | Sierra Leone | 99.9 /100 | #44 | Exceptional 26.9% |
| Latvians | 99.9 /100 | #45 | Exceptional 26.9% |
| Immigrants | Serbia | 99.9 /100 | #46 | Exceptional 26.9% |
| Egyptians | 99.8 /100 | #47 | Exceptional 26.9% |
| Immigrants | Poland | 99.8 /100 | #48 | Exceptional 26.9% |
Demographics Similar to English by Single Mother Poverty
In terms of single mother poverty, the demographic groups most similar to English are Immigrants from Barbados (30.2%, a difference of 0.040%), Spaniard (30.2%, a difference of 0.13%), Dutch (30.2%, a difference of 0.15%), Alaskan Athabascan (30.3%, a difference of 0.19%), and Immigrants from Liberia (30.1%, a difference of 0.25%).
| Demographics | Rating | Rank | Single Mother Poverty |
| Immigrants | Cuba | 6.9 /100 | #223 | Tragic 30.1% |
| Immigrants | Sudan | 6.5 /100 | #224 | Tragic 30.1% |
| Spanish | 6.3 /100 | #225 | Tragic 30.1% |
| Scottish | 6.0 /100 | #226 | Tragic 30.1% |
| Immigrants | Liberia | 5.9 /100 | #227 | Tragic 30.1% |
| Spaniards | 5.4 /100 | #228 | Tragic 30.2% |
| Immigrants | Barbados | 5.0 /100 | #229 | Tragic 30.2% |
| English | 4.8 /100 | #230 | Tragic 30.2% |
| Dutch | 4.3 /100 | #231 | Tragic 30.2% |
| Alaskan Athabascans | 4.1 /100 | #232 | Tragic 30.3% |
| Immigrants | Middle Africa | 3.5 /100 | #233 | Tragic 30.3% |
| Immigrants | Nicaragua | 3.5 /100 | #234 | Tragic 30.3% |
| Immigrants | Grenada | 3.4 /100 | #235 | Tragic 30.3% |
| Welsh | 3.2 /100 | #236 | Tragic 30.4% |
| Immigrants | St. Vincent and the Grenadines | 3.1 /100 | #237 | Tragic 30.4% |